

Answered step by step
Verified Expert Solution
Question
1 Approved Answer
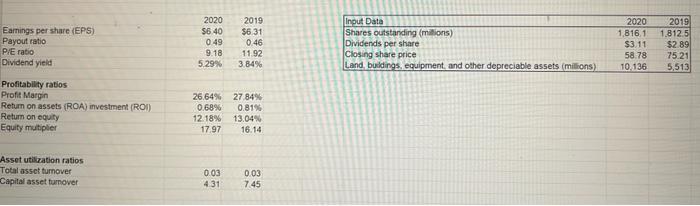
Earnings per share (EPS) Payout ratio P/E ratio Dividend yield 2020 $6.40 049 9.18 2019 $6.31 0.46 11.92 3.84% Input Data Shares outstanding (millions) Dividends
Step by Step Solution
There are 3 Steps involved in it
Step: 1

Get Instant Access to Expert-Tailored Solutions
See step-by-step solutions with expert insights and AI powered tools for academic success
Step: 2

Step: 3
Ace Your Homework with AI
Get the answers you need in no time with our AI-driven, step-by-step assistance
Get Started
Financial management theory and practice
Authors: Eugene F. Brigham and Michael C. Ehrhardt
13th edition
1439078106, 111197375X, 9781439078105, 9781111973759, 978-1439078099