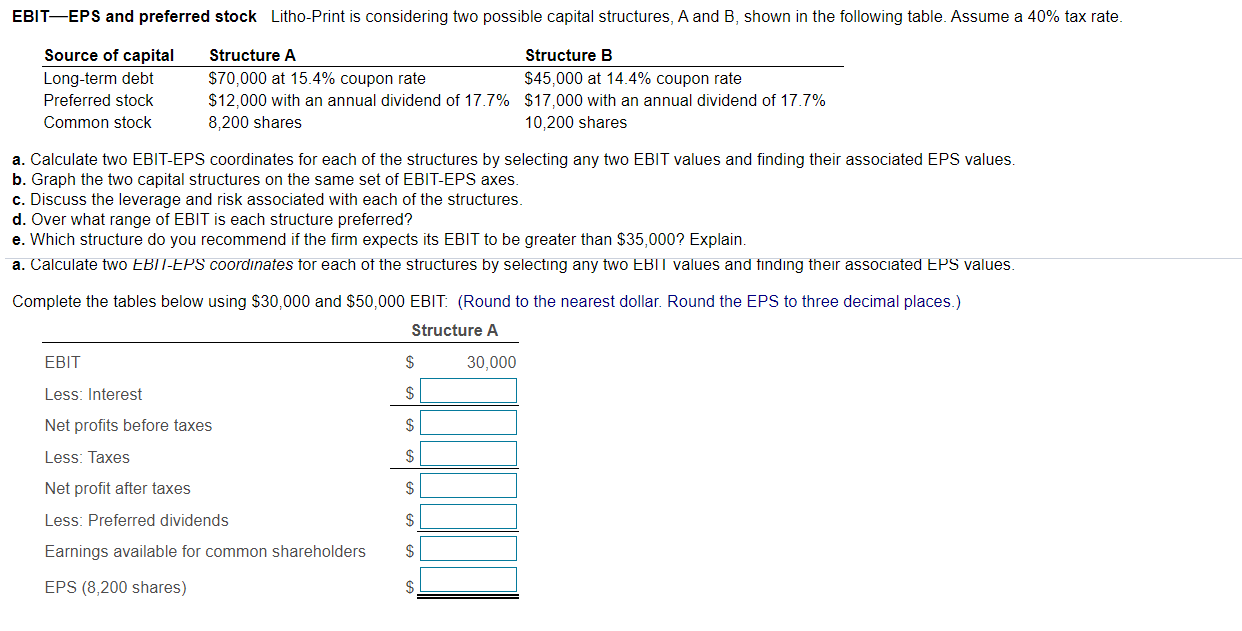
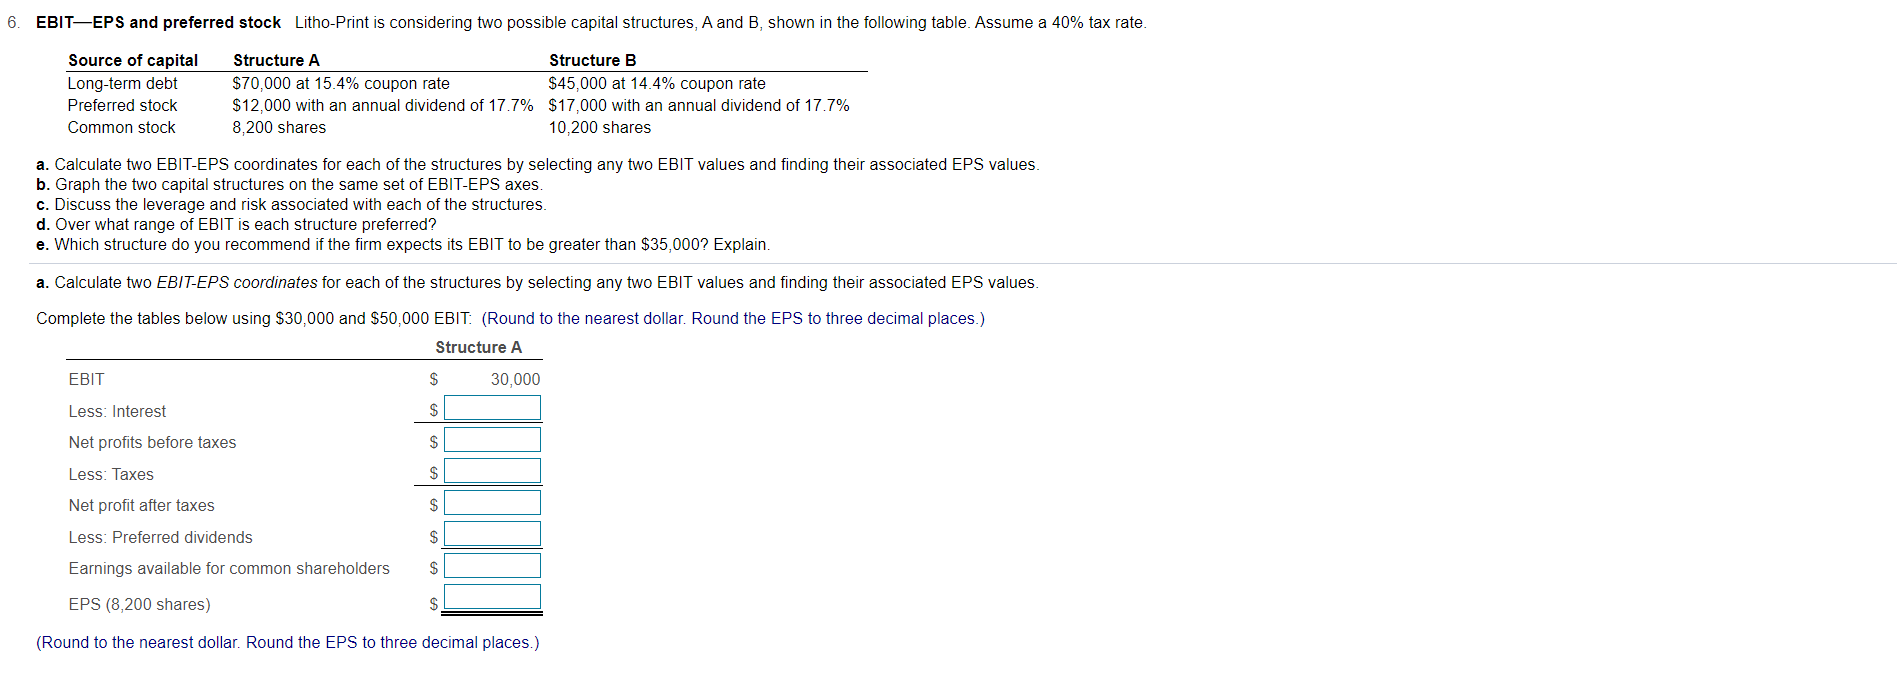
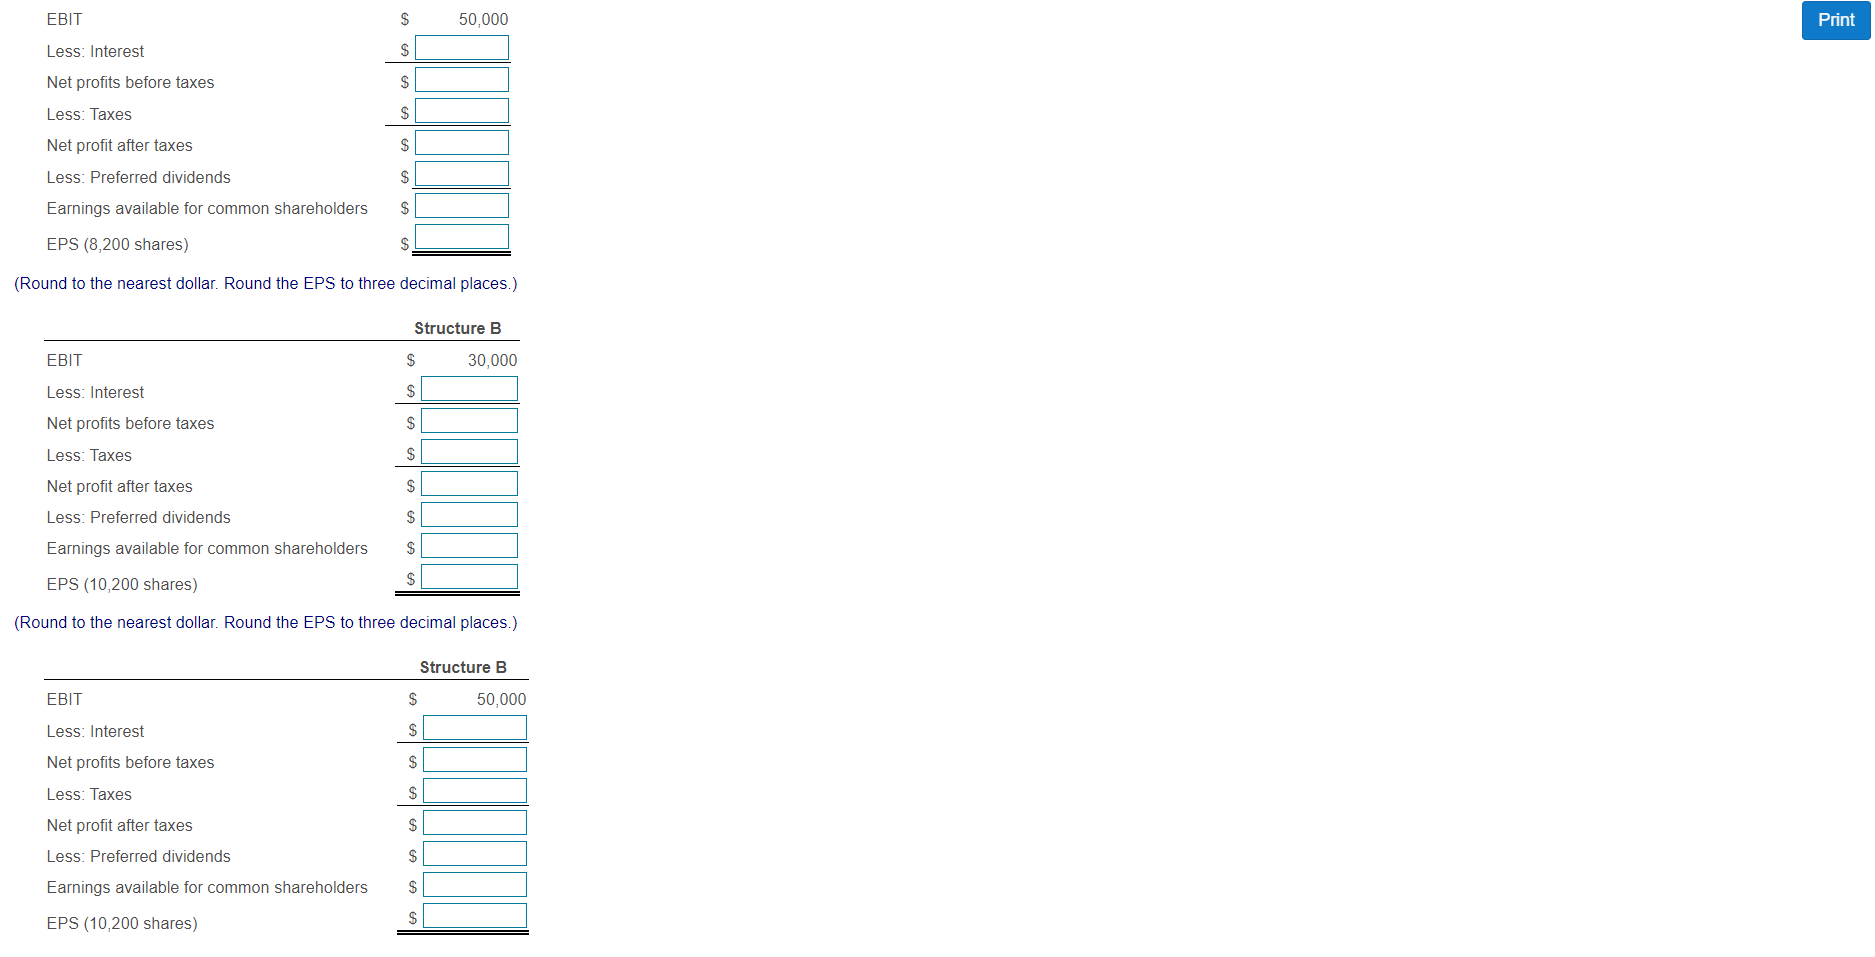
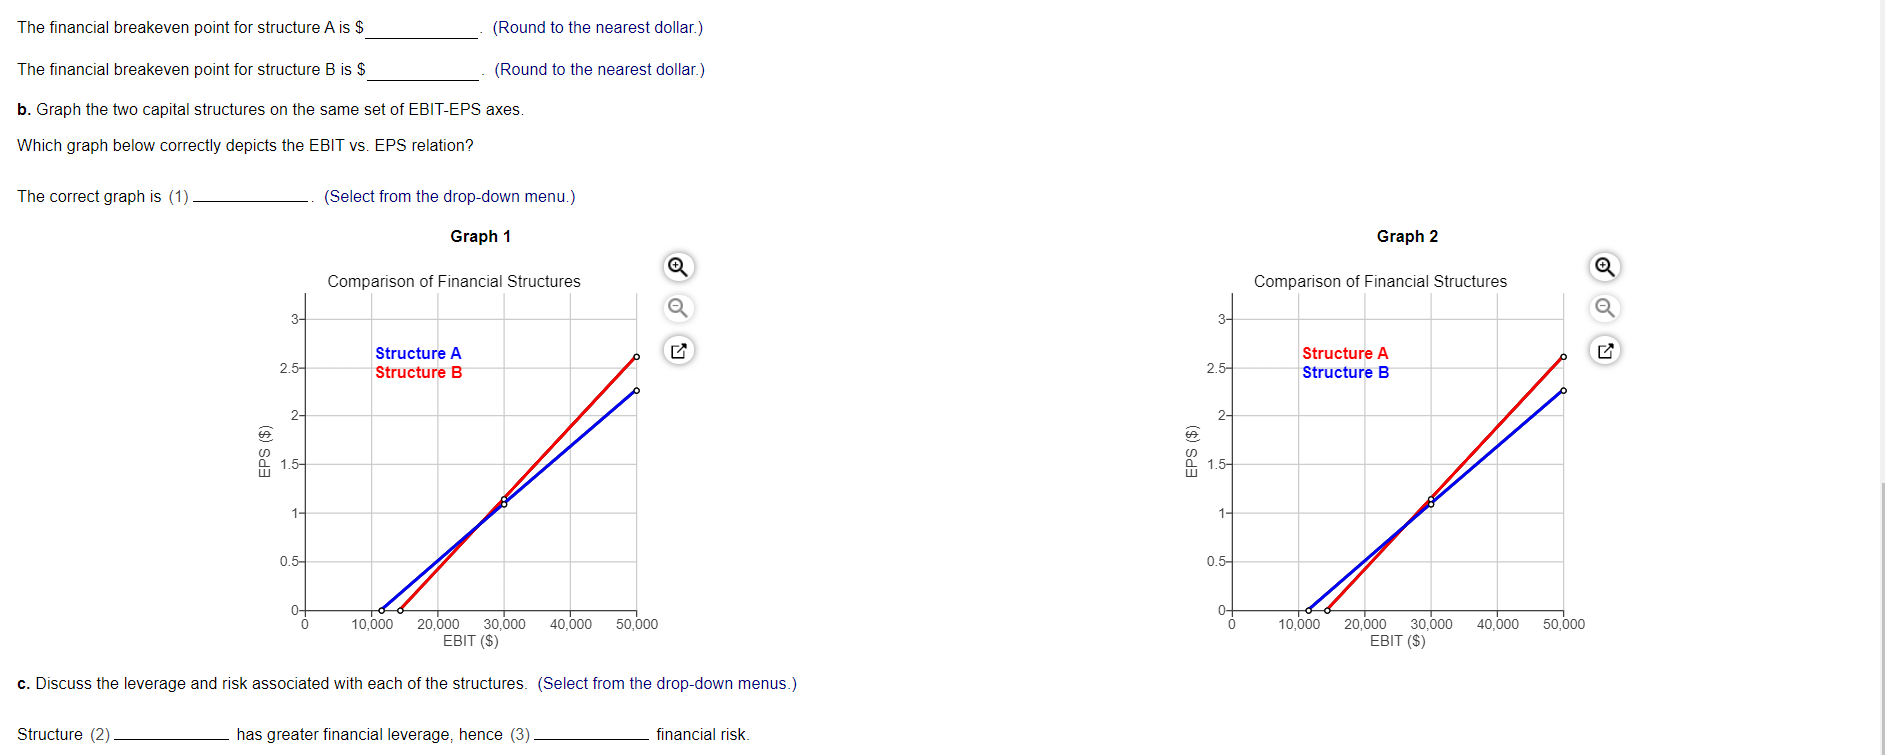
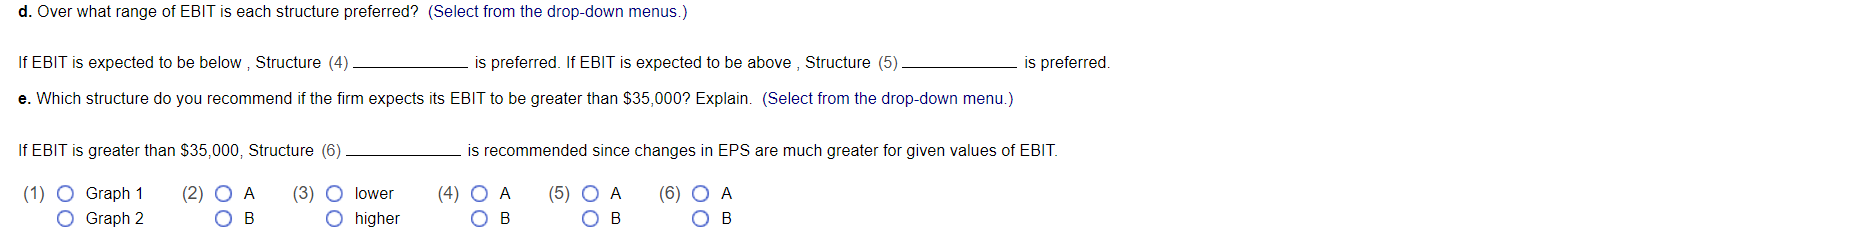
EBITEPS and preferred stock Litho-Print is considering two possible capital structures, A and B, shown in the following table. Assume a 40% tax rate. Source of capital Long-term debt Preferred stock Common stock Structure A Structure B $70,000 at 15.4% coupon rate $45,000 at 14.4% coupon rate $12,000 with an annual dividend of 17.7% $17,000 with an annual dividend of 17.7% 8,200 shares 10,200 shares a. Calculate two EBIT-EPS coordinates for each of the structures by selecting any two EBIT values and finding their associated EPS values. b. Graph the two capital structures on the same set of EBIT-EPS axes. c. Discuss the leverage and risk associated with each of the structures. d. Over what range of EBIT is each structure preferred? e. Which structure do you recommend if the firm expects its EBIT to be greater than $35,000? Explain. a. Calculate two EBIT-EPS coordinates for each of the structures by selecting any two EBIT values and finding their associated EPS values. Complete the tables below using $30,000 and $50,000 EBIT: (Round to the nearest dollar. Round the EPS to three decimal places.) Structure A EBIT $ 30,000 Less: Interest $ Net profits before taxes $ Less: Taxes $ Net profit after taxes $ Less: Preferred dividends S Earnings available for common shareholders S EPS (8,200 shares) $ 6 EBITEPS and preferred stock Litho-Print is considering two possible capital structures, A and B, shown in the following table. Assume a 40% tax rate. Source of capital Long-term debt Preferred stock Common stock Structure A Structure B $70,000 at 15.4% coupon rate $45,000 at 14.4% coupon rate $12,000 with an annual dividend of 17.7% $17,000 with an annual dividend of 17.7% 8,200 shares 10,200 shares a. Calculate two EBIT-EPS coordinates for each of the structures by selecting any two EBIT values and finding their associated EPS values. b. Graph the two capital structures on the same set of EBIT-EPS axes. c. Discuss the leverage and risk associated with each of the structures. d. Over what range of EBIT is each structure preferred? e. Which structure do you recommend if the firm expects its EBIT to be greater than $35,000? Explain. a. Calculate two EBIT-EPS coordinates for each of the structures by selecting any two EBIT values and finding their associated EPS values. Complete the tables below using $30,000 and $50,000 EBIT: (Round to the nearest dollar. Round the EPS to three decimal places.) Structure A EBIT S 30,000 Less: Interest $ Net profits before taxes $ Less: Taxes $ Net profit after taxes $ Less: Preferred dividends $ Earnings available for common shareholders $ EPS (8,200 shares) S (Round to the nearest dollar. Round the EPS to three decimal places.) EBIT $ 50,000 Print Less: Interest $ Net profits before taxes $ Less: Taxes $ $ Net profit after taxes Less: Preferred dividends Earnings available for common shareholders $ S EPS (8,200 shares) S (Round to the nearest dollar. Round the EPS to three decimal places.) Structure B EBIT $ 30,000 $ $ S Less: Interest Net profits before taxes Less: Taxes Net profit after taxes Less: Preferred dividends Earnings available for common shareholders S $ $ EPS (10,200 shares) $ (Round to the nearest dollar. Round the EPS to three decimal places.) Structure B EBIT $ 50,000 Less: Interest $ Net profits before taxes $ Less: Taxes $ Net profit after taxes S Less: Preferred dividends S Earnings available for common shareholders $ EPS (10,200 shares) $ The financial breakeven point for structure A is $ (Round to the nearest dollar.) The financial breakeven point for structure B is $ (Round to the nearest dollar.) b. Graph the two capital structures on the same set of EBIT-EPS axes. Which graph below correctly depicts the EBIT vs. EPS relation? The correct graph is (1) (Select from the drop-down menu.) Graph 1 Graph 2 Comparison of Financial Structures Comparison of Financial Structures 31 3- _ 2.5- Structure A Structure B 2.5- Structure A Structure B 2- 2- EPS ($) EPS ($) 1.5- 1.5- 1- 1- 0.5 0.5- 0- 0- 10,000 40.000 50,000 10,000 20,000 30.000 EBIT ($) 40,000 20,000 30.000 EBIT ($) 50,000 c. Discuss the leverage and risk associated with each of the structures. (Select from the drop-down menus.) Structure (2) has greater financial leverage, hence (3) financial risk. d. Over what range of EBIT is each structure preferred? (Select from the drop-down menus.) If EBIT is expected to be below, Structure (4) is preferred. If EBIT is expected to be above, Structure (5). is preferred e. Which structure do you recommend if the firm expects its EBIT to be greater than $35,000? Explain. (Select from the drop-down menu.) If EBIT is greater than $35,000, Structure (6) is recommended since changes in EPS are much greater for given values of EBIT. (1) O Graph 1 O Graph 2 (2) OA OB (3) O lower O higher (4) (5) OA (6) OA OB EBITEPS and preferred stock Litho-Print is considering two possible capital structures, A and B, shown in the following table. Assume a 40% tax rate. Source of capital Long-term debt Preferred stock Common stock Structure A Structure B $70,000 at 15.4% coupon rate $45,000 at 14.4% coupon rate $12,000 with an annual dividend of 17.7% $17,000 with an annual dividend of 17.7% 8,200 shares 10,200 shares a. Calculate two EBIT-EPS coordinates for each of the structures by selecting any two EBIT values and finding their associated EPS values. b. Graph the two capital structures on the same set of EBIT-EPS axes. c. Discuss the leverage and risk associated with each of the structures. d. Over what range of EBIT is each structure preferred? e. Which structure do you recommend if the firm expects its EBIT to be greater than $35,000? Explain. a. Calculate two EBIT-EPS coordinates for each of the structures by selecting any two EBIT values and finding their associated EPS values. Complete the tables below using $30,000 and $50,000 EBIT: (Round to the nearest dollar. Round the EPS to three decimal places.) Structure A EBIT $ 30,000 Less: Interest $ Net profits before taxes $ Less: Taxes $ Net profit after taxes $ Less: Preferred dividends S Earnings available for common shareholders S EPS (8,200 shares) $ 6 EBITEPS and preferred stock Litho-Print is considering two possible capital structures, A and B, shown in the following table. Assume a 40% tax rate. Source of capital Long-term debt Preferred stock Common stock Structure A Structure B $70,000 at 15.4% coupon rate $45,000 at 14.4% coupon rate $12,000 with an annual dividend of 17.7% $17,000 with an annual dividend of 17.7% 8,200 shares 10,200 shares a. Calculate two EBIT-EPS coordinates for each of the structures by selecting any two EBIT values and finding their associated EPS values. b. Graph the two capital structures on the same set of EBIT-EPS axes. c. Discuss the leverage and risk associated with each of the structures. d. Over what range of EBIT is each structure preferred? e. Which structure do you recommend if the firm expects its EBIT to be greater than $35,000? Explain. a. Calculate two EBIT-EPS coordinates for each of the structures by selecting any two EBIT values and finding their associated EPS values. Complete the tables below using $30,000 and $50,000 EBIT: (Round to the nearest dollar. Round the EPS to three decimal places.) Structure A EBIT S 30,000 Less: Interest $ Net profits before taxes $ Less: Taxes $ Net profit after taxes $ Less: Preferred dividends $ Earnings available for common shareholders $ EPS (8,200 shares) S (Round to the nearest dollar. Round the EPS to three decimal places.) EBIT $ 50,000 Print Less: Interest $ Net profits before taxes $ Less: Taxes $ $ Net profit after taxes Less: Preferred dividends Earnings available for common shareholders $ S EPS (8,200 shares) S (Round to the nearest dollar. Round the EPS to three decimal places.) Structure B EBIT $ 30,000 $ $ S Less: Interest Net profits before taxes Less: Taxes Net profit after taxes Less: Preferred dividends Earnings available for common shareholders S $ $ EPS (10,200 shares) $ (Round to the nearest dollar. Round the EPS to three decimal places.) Structure B EBIT $ 50,000 Less: Interest $ Net profits before taxes $ Less: Taxes $ Net profit after taxes S Less: Preferred dividends S Earnings available for common shareholders $ EPS (10,200 shares) $ The financial breakeven point for structure A is $ (Round to the nearest dollar.) The financial breakeven point for structure B is $ (Round to the nearest dollar.) b. Graph the two capital structures on the same set of EBIT-EPS axes. Which graph below correctly depicts the EBIT vs. EPS relation? The correct graph is (1) (Select from the drop-down menu.) Graph 1 Graph 2 Comparison of Financial Structures Comparison of Financial Structures 31 3- _ 2.5- Structure A Structure B 2.5- Structure A Structure B 2- 2- EPS ($) EPS ($) 1.5- 1.5- 1- 1- 0.5 0.5- 0- 0- 10,000 40.000 50,000 10,000 20,000 30.000 EBIT ($) 40,000 20,000 30.000 EBIT ($) 50,000 c. Discuss the leverage and risk associated with each of the structures. (Select from the drop-down menus.) Structure (2) has greater financial leverage, hence (3) financial risk. d. Over what range of EBIT is each structure preferred? (Select from the drop-down menus.) If EBIT is expected to be below, Structure (4) is preferred. If EBIT is expected to be above, Structure (5). is preferred e. Which structure do you recommend if the firm expects its EBIT to be greater than $35,000? Explain. (Select from the drop-down menu.) If EBIT is greater than $35,000, Structure (6) is recommended since changes in EPS are much greater for given values of EBIT. (1) O Graph 1 O Graph 2 (2) OA OB (3) O lower O higher (4) (5) OA (6) OA OB