Answered step by step
Verified Expert Solution
Link Copied!

Question

1 Approved Answer

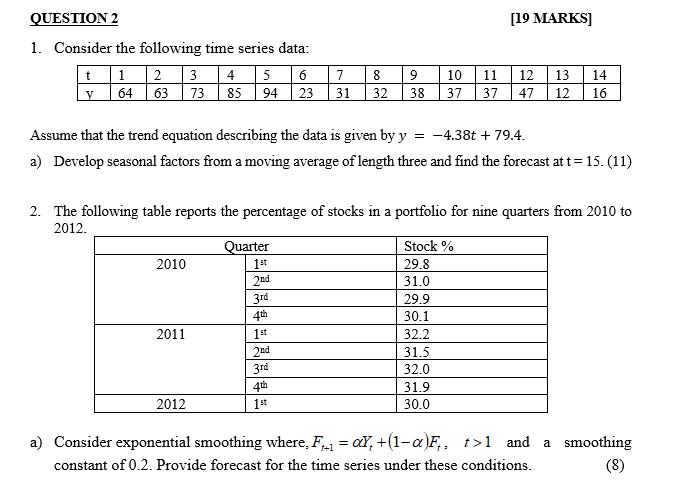
ECONOMETRICS QUESTION 2 [19 MARKS] 1. Consider the following time series data: t 2 3 4 5 6 7 8 9 10 11 12 13

ECONOMETRICS

image text in transcribed
QUESTION 2 [19 MARKS] 1. Consider the following time series data: t 2 3 4 5 6 7 8 9 10 11 12 13 14 V 64 63 73 85 94 23 31 32 38 37 37 47 12 16 Assume that the trend equation describing the data is given by y = -4.38t + 79.4. a) Develop seasonal factors from a moving average of length three and find the forecast at t = 15. (11) 2. The following table reports the percentage of stocks in a portfolio for nine quarters from 2010 to 2012. Quarter Stock % 2010 1 st 29.8 and 31.0 3rd 29.9 4th 30.1 2011 1 #1 32.2 31.5 3rd 32.0 d th 31.9 2012 1# 30.0 a) Consider exponential smoothing where. F. = QY, +(1-@)F,, #>1 and a smoothing constant of 0.2. Provide forecast for the time series under these conditions. (8)

Step by Step Solution

There are 3 Steps involved in it

Step: 1

blur-text-image

Get Instant Access to Expert-Tailored Solutions

See step-by-step solutions with expert insights and AI powered tools for academic success

Step: 2

blur-text-image

Step: 3

blur-text-image

Ace Your Homework with AI

Get the answers you need in no time with our AI-driven, step-by-step assistance

Get Started

Recommended Textbook for

Finite Math And Applied Calculus

Authors: Stefan Waner, Steven Costenoble

7th Edition

1337515566, 9781337515566

More Books

Students also viewed these Mathematics questions