Economics for management.
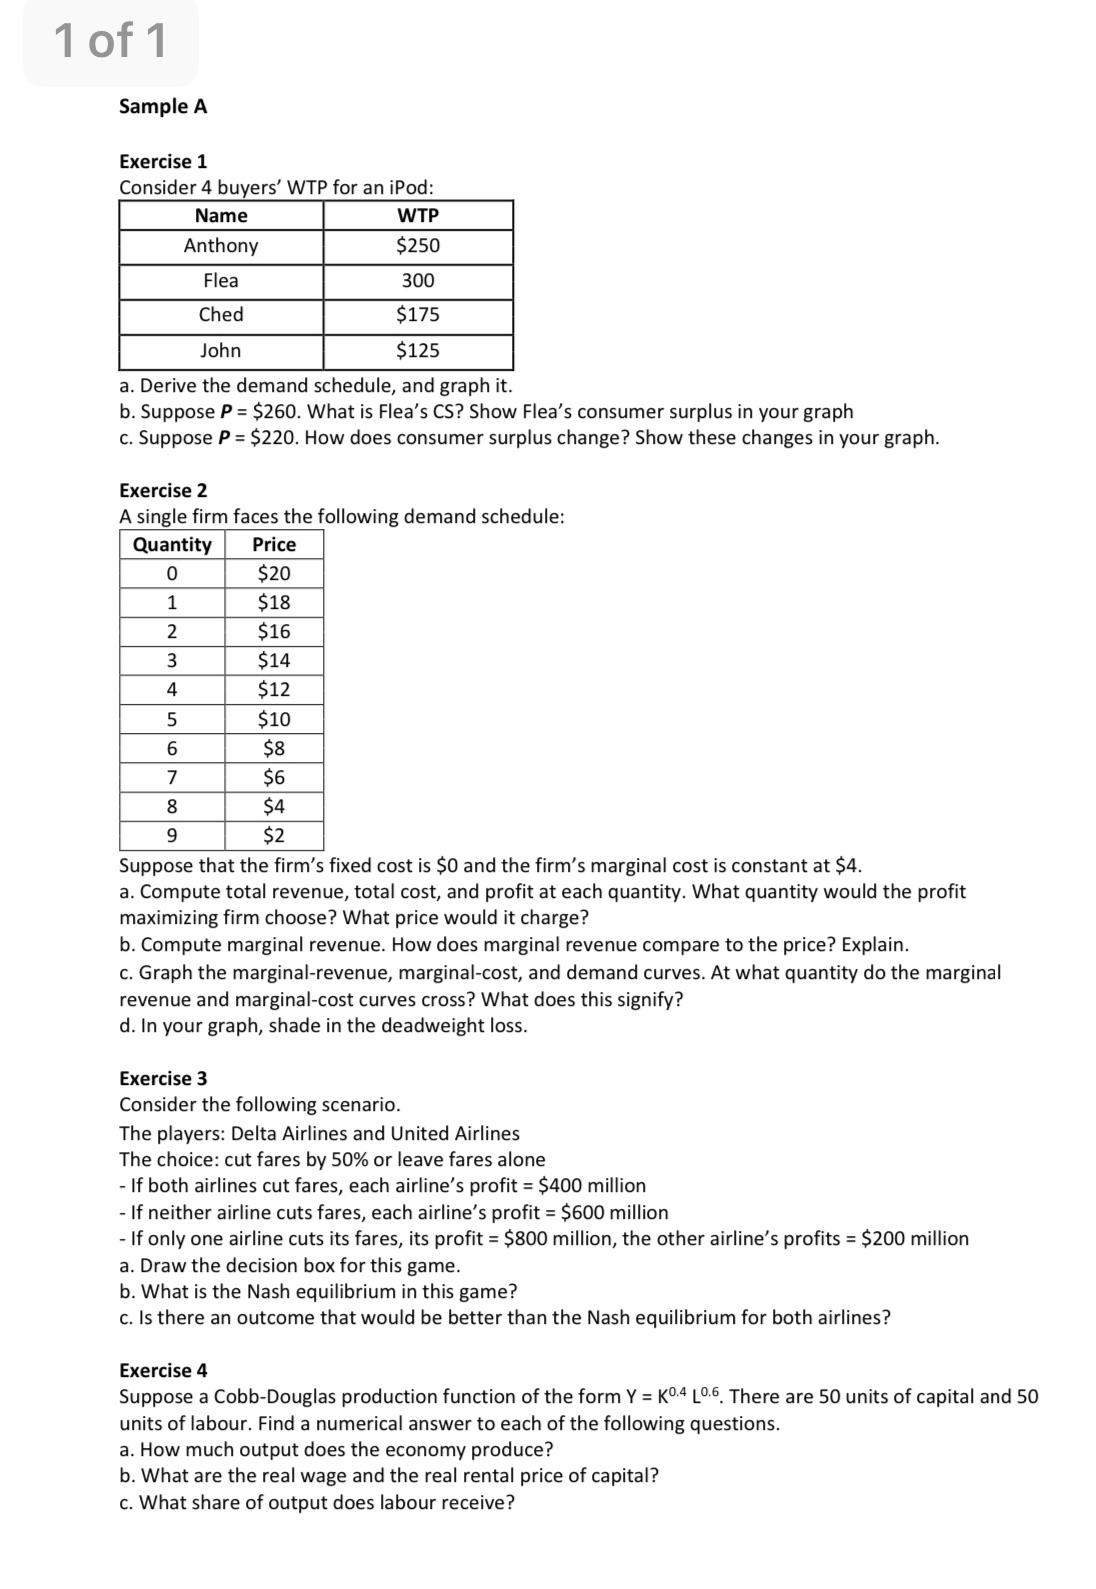
1of1 Sample A Exercise 1 Consider4 buyers' WTP for an iPod: a. Derive the demand schedule, and graph it. b. Suppose P = $260. What is Flea's CS? Show Flea's consumer surplus in your graph c. Suppose P = $220. How does consumer surplus change? Show these changes in your graph. Exercise 2 A single firm faces the following demand schedule: Suppose that the firm's fixed cost is $0 and the firm's marginal cost is constant at $4. a. Compute total revenue. total cost, and profit at each quantity. What quantity would the prot maximizing firm choose? What price would it charge? b. Compute marginal revenue. How does marginal revenue compare to the price? Explain. c. Graph the marginal-revenue, marginal-cost, and demand curves. At what quantity do the marginal revenue and marginal-cost curves cross? What does this signify? d. In your graph, shade in the deadweight loss. Exercise 3 Consider the following scenario. The players: Delta Airlines and United Airlines The choice: cut fares by 50% or leave fares alone - If both airlines cut fares, each airline's profit = $400 million - If neither airline cuts fares, each airline's prot = $600 million - If only one airline cuts its fares. its prot = $800 million, the other airline's prots = $200 million a. Draw the decision box for this game. b. What is the Nash equilibrium in this game? c. Is there an outcome that would be better than the Nash equilibrium for both airlines? Exercise 4 Suppose a Cobb-Douglas production function of the form Y = K\" L\". There are 50 units of capital and 50 units of labour. Find a numerical answer to each of the following questions. a. How much output does the economy produce? b. What are the real wage and the real rental price of capital? c. What share of output does labour receive