Answered step by step
Verified Expert Solution
Link Copied!

Question

1 Approved Answer

Economics question Score: 0 of 1 pt 11 of 28 (5 complete) HW Score: 14.29%, 7.3 Review Quiz 3 Question The figure Illustrates the demand

Economics question
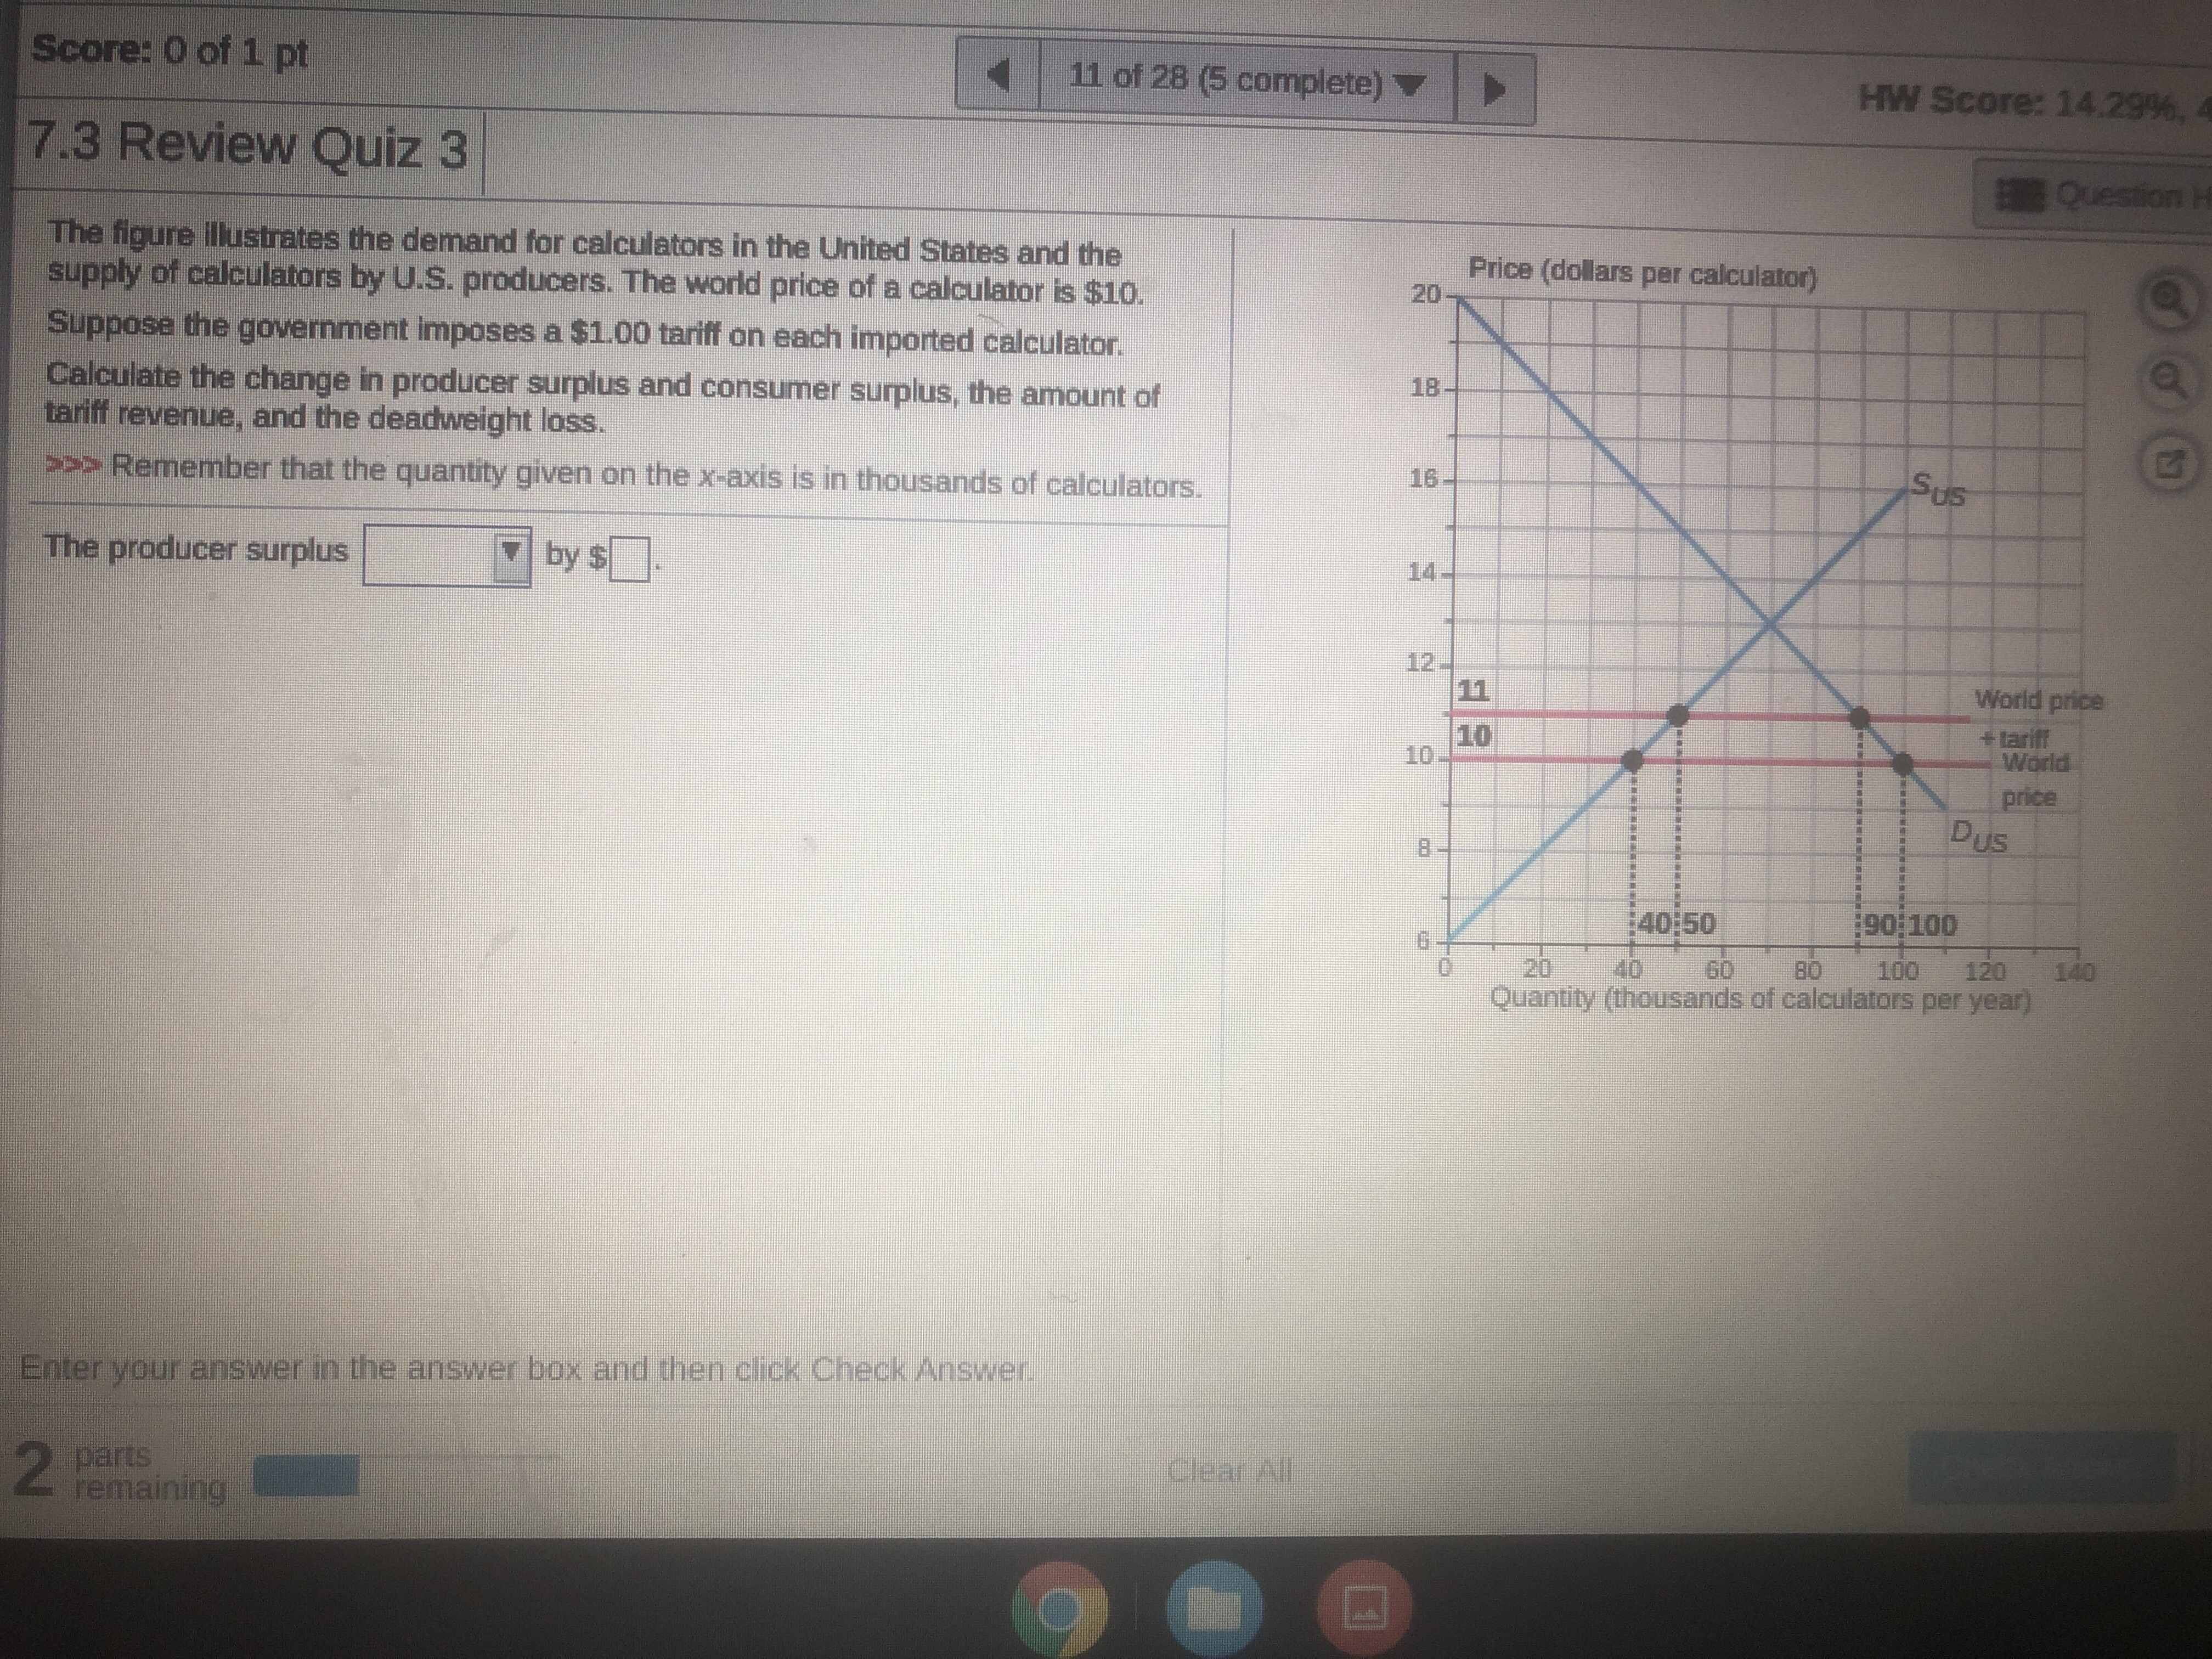
image text in transcribed
Score: 0 of 1 pt 11 of 28 (5 complete) HW Score: 14.29%, 7.3 Review Quiz 3 Question The figure Illustrates the demand for calculators in the United States and the supply of calculators by U.S. producers. The world price of a calculator is $10. 20 Price (dollars per calculator) Suppose the government imposes a $1.00 tariff on each imported calculator. Calculate the change in producer surplus and consumer surplus, the amount of 18 tariff revenue, and the deadweight loss. Remember that the quantity given on the x-axis is in thousands of calculators. 16 Sus The producer surplus by $ 14 12 - 11 World price 10 + tariff World price Dus :40:50 90 100 40 GO 100 120 Quantity (thousands of calculators per year) Enter your answer in the answer box and then click Check Answer 2 parts remaining

Step by Step Solution

There are 3 Steps involved in it

Step: 1

blur-text-image

Get Instant Access to Expert-Tailored Solutions

See step-by-step solutions with expert insights and AI powered tools for academic success

Step: 2

blur-text-image

Step: 3

blur-text-image

Ace Your Homework with AI

Get the answers you need in no time with our AI-driven, step-by-step assistance

Get Started

Recommended Textbook for

Business Statistics for Contemporary Decision Making

Authors: Ken Black

6th Edition

978-0470409015, 9780470559062, 470409010, 470559063, 978-0470910184

More Books

Students also viewed these Economics questions

Question

How are premiums and discounts presented on the balance sheet?

Answered: 1 week ago