edit: added DATASET : https://ufile.io/c99q1 [YEAST.DATA]
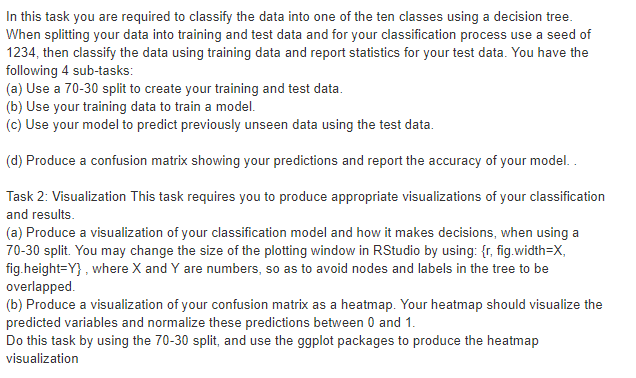
In this task you are required to classify the data into one of the ten classes using a decision tree When splitting your data into training and test data and for your classification process use a seed of 1234, then classify the data using training data and report statistics for your test data. You have the following 4 sub-tasks (a) Use a 70-30 split to create your training and test data b) Use your training data to train a model. (c) Use your model to predict previously unseen data using the test data (d) Produce a confusion matrix showing your predictions and report the accuracy of your model. Task 2: Visualization This task requires you to produce appropriate visualizations of your classification and results. (a) Produce a visualization of your classification model and how it makes decisions, when using a 70-30 split. You may change the size of the plotting window in RStudio by using: (r, fig width-X, ig.height-Ywhere X and Y are numbers, so as to avoid nodes and labels in the tree to be overlapped (b) Produce a visualization of your confusion matrix as a heatmap. Your heatmap should visualize the predicted variables and normalize these predictions between 0 and 1 Do this task by using the 70-30 split, and use the ggplot packages to produce the heatmap visualization In this task you are required to classify the data into one of the ten classes using a decision tree When splitting your data into training and test data and for your classification process use a seed of 1234, then classify the data using training data and report statistics for your test data. You have the following 4 sub-tasks (a) Use a 70-30 split to create your training and test data b) Use your training data to train a model. (c) Use your model to predict previously unseen data using the test data (d) Produce a confusion matrix showing your predictions and report the accuracy of your model. Task 2: Visualization This task requires you to produce appropriate visualizations of your classification and results. (a) Produce a visualization of your classification model and how it makes decisions, when using a 70-30 split. You may change the size of the plotting window in RStudio by using: (r, fig width-X, ig.height-Ywhere X and Y are numbers, so as to avoid nodes and labels in the tree to be overlapped (b) Produce a visualization of your confusion matrix as a heatmap. Your heatmap should visualize the predicted variables and normalize these predictions between 0 and 1 Do this task by using the 70-30 split, and use the ggplot packages to produce the heatmap visualization