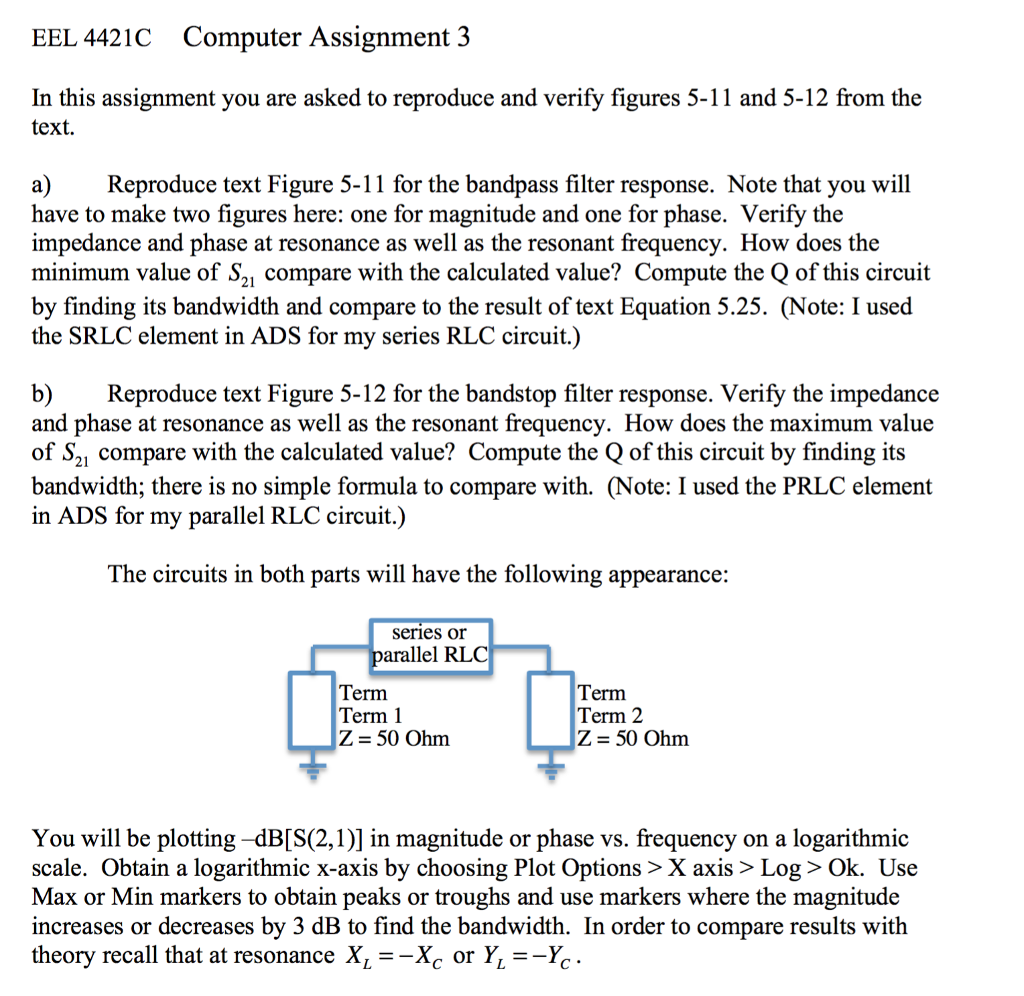
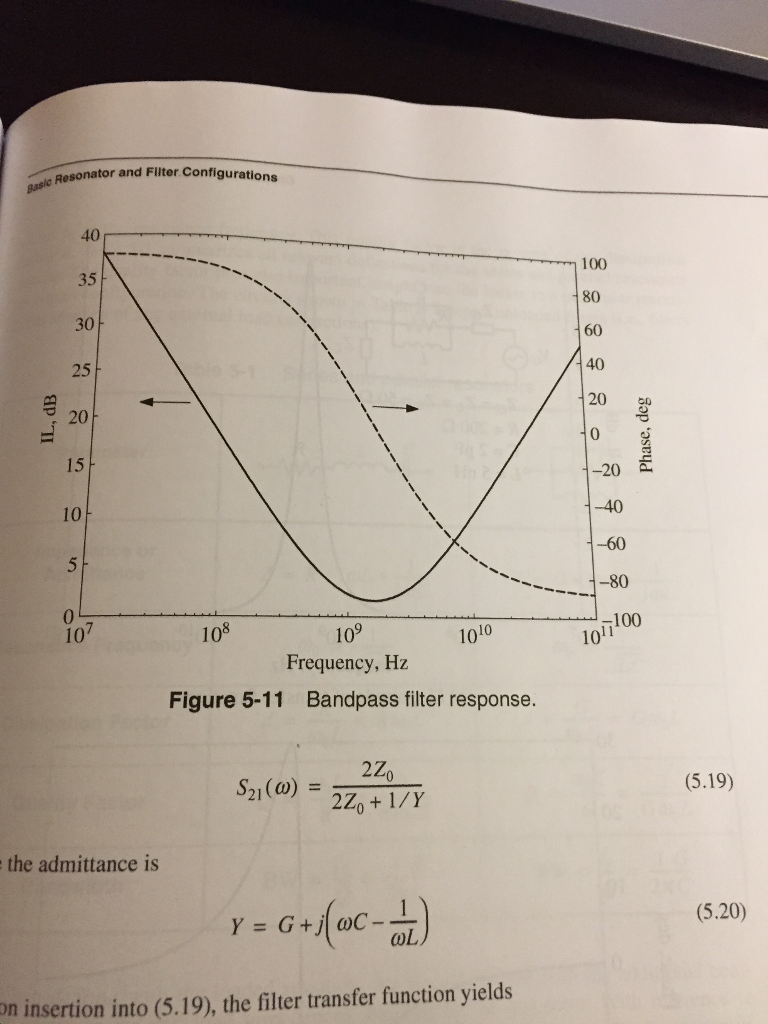
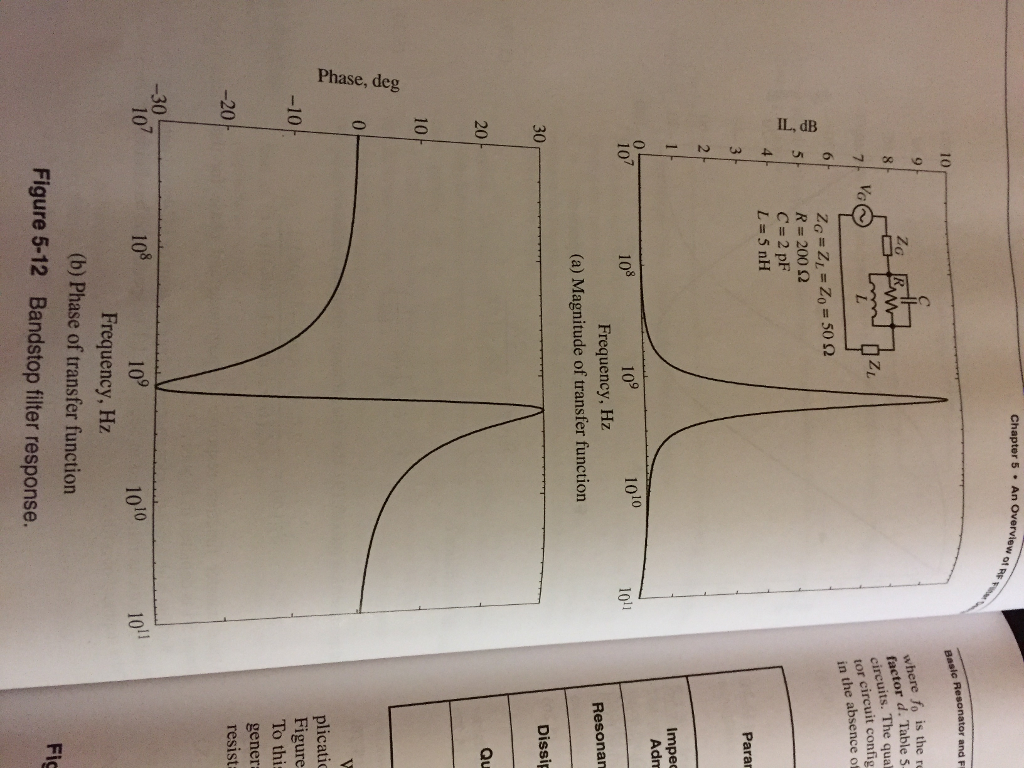
EEL 4421C Computer Assignment 3 In this assignment you are asked to reproduce and verify figures 5-11 and 5-12 from the text. a)Reproduce text Figure 5-11 for the bandpass filter response. Note that you will have to make two figures here: one for magnitude and one for phase. Verify the impedance and phase at resonance as well as the resonant frequency. How does the minimum value of S^ compare with the calculated value? Compute the Q of this circuit by finding its bandwidth and compare to the result of text Equation 5.25. (Note: I used the SRLC element in ADS for my series RLC circuit.) b)Reproduce text Figure 5-12 for the bandstop filter response. Verify the impedance and phase at resonance as well as the resonant frequency. How does the maximum value of S compare with the calculated value? Compute the Q of this circuit by finding its bandwidth; there is no simple formula to compare with. (Note: I used the PRLC element in ADS for my parallel RLC circuit.) The circuits in both parts will have the following appearance: series or arallel RLC Term Term 1 Z-50 Ohm Term Term 2 Z - 50 Ohm You will be plotting -dB[S(2,1)] in magnitude or phase vs. frequency on a logarithmic scale. Obtain a logarithmic x-axis by choosing Plot Options > X axis > Log > Ok. Use Max or Min markers to obtain peaks or troughs and use markers where the magnitude increases or decreases by 3 dB to find the bandwidth. In order to compare results with theory recall that at resonance X,--Xc or Y,--1Y EEL 4421C Computer Assignment 3 In this assignment you are asked to reproduce and verify figures 5-11 and 5-12 from the text. a)Reproduce text Figure 5-11 for the bandpass filter response. Note that you will have to make two figures here: one for magnitude and one for phase. Verify the impedance and phase at resonance as well as the resonant frequency. How does the minimum value of S^ compare with the calculated value? Compute the Q of this circuit by finding its bandwidth and compare to the result of text Equation 5.25. (Note: I used the SRLC element in ADS for my series RLC circuit.) b)Reproduce text Figure 5-12 for the bandstop filter response. Verify the impedance and phase at resonance as well as the resonant frequency. How does the maximum value of S compare with the calculated value? Compute the Q of this circuit by finding its bandwidth; there is no simple formula to compare with. (Note: I used the PRLC element in ADS for my parallel RLC circuit.) The circuits in both parts will have the following appearance: series or arallel RLC Term Term 1 Z-50 Ohm Term Term 2 Z - 50 Ohm You will be plotting -dB[S(2,1)] in magnitude or phase vs. frequency on a logarithmic scale. Obtain a logarithmic x-axis by choosing Plot Options > X axis > Log > Ok. Use Max or Min markers to obtain peaks or troughs and use markers where the magnitude increases or decreases by 3 dB to find the bandwidth. In order to compare results with theory recall that at resonance X,--Xc or Y,--1Y