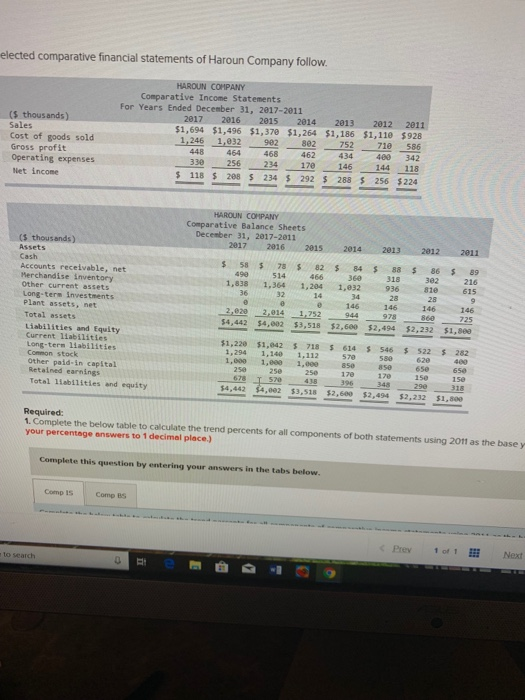
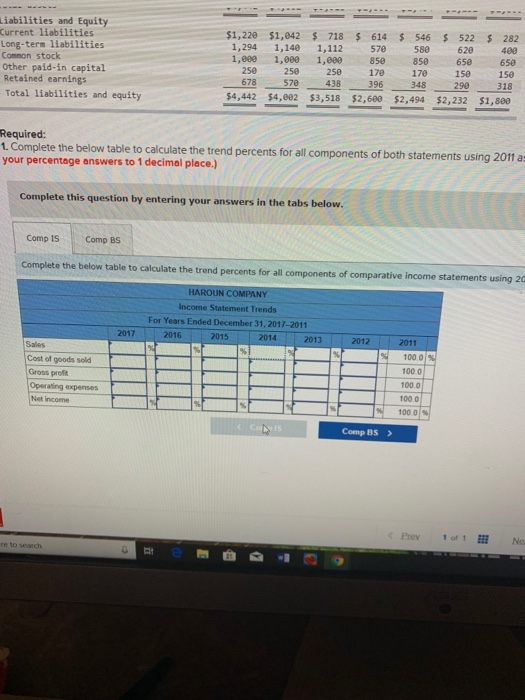
elected comparative financial statements of Haroun Company follow. HAROUN COMPANY Comparative Income Statements For Years Ended December 31, 2017-2011 2016 2015 2011 $1,694 $1,496 $1,370 $1,264 $1,186 $1,110 $ 928 586 2014 2013 2012 ($ thousands) Sales Cost of goods sold Gross profit 2017 710 1,246 1,032 448 902 802 752 400 468 462 464 434 342 256 234 170 146 144 118 Operating expenses 330 118 $208 S 234 $292 $ 288 S 256 $224 Net income HAROUN COMPANY Comparative Balance Sheets December 31, 2017-2011 2016 (S thousands) Assets Cash 2017 2013 2012 2015 2014 2011 $ 58 $ 490 82 466 1,204 89 78 $ 84 360 1,032 88 318 936 28 86 Accounts receivable, net Merchandise inventory Other current assets Long-term investments Plant assets, net 302 514 1.364 32 216 615 1,838 810 28 ... 36 34 14 146 146 978 146 146 2.020 2.014 944 860 1,752 725 Total assets $4,002 $4,442 $3,518 $2,600 $2,494 $2,232 $1,800 Liabilities and Equity Current 1iabilitles Long-term 1iabilities Common stock Other paid-in capital Retained earnings $1,220 1,294 1,000 $1.042 $ 718 $ 522 $ 282 620 400 614 546 1.140 1.112 1,000 580 850 170 570 1,e00 25e 850 65e 650 15e 318 250 250 170 396 150 290 678 T 570 438 348 Total liabilities and equity $4,002 $4,442 $3,518 $2,600 $2.494 $2,232 $1,800 Required: 1. Complete the below table to calculate the trend percents for all components of both statements using 2011 as the base y your percentage answers to 1 decimal place.) Complete this question by entering your answers in the tabs below. Comp 15 Comp BS th Prev 1 of 1 Next to search Liabilities and Equity Current liabilities Long-term liabilities Common stock Other paid-in capital Retained earnings Total liabilities and equity $1,220 1,294 1,000 $1,042 1,140 1,000 $ 718 $ 614 546 522 S $ 282 400 650 1,112 1,00e 250 570 580 628 850 850 650 250 250 170 170 150 150 678 570 438 396 348 290 318 $4,442 $4,002 $3,518 $2,6e0 $2,494 $2,232 $1,800 Required: 1. Complete the below table to calculate the trend percents for all components of both statements using 2011 as your percentage answers to 1 decimal place.) Complete this question by entering your answers in the tabs below. Comp IS Comp BS Complete the below table to calculate the trend percents for all components of comparative income statements using 20 HAROUN COMPANY Income Statement Trends For Years Ended December 31, 2017-2011 2017 2016 2015 2014 2013 2012 Sales 2011 100 0 %) Cost of goods sold Gross profit 100.0 Operating expenses Net income 100.0 100.0 100 0 % Comp BS Prey 1 of 1 No ce to search