

Question: electricity spread sheet natural gas operating hours These 3 sheet is for energy used Raw data. Base and heat base heat and cool Base heat
electricity spread sheet
natural gas

operating hours
These 3 sheet is for energy used Raw data.
Base and heat
base heat and cool
Base heat cool and production
Base cool heat and no production
random
Instructions
Time series graph(s) plotting the electricity monthly consumption, natural gas monthly consumption, CDD, and HDD.
Time series graph for total energy in GJ (hint: convert electricity to GJ then add it to natural gas to calculate total energy in GJ).
Scatter plots for electricity vs. cooling degree days and natural gas energy consumption vs heating degree days. Show the trendlines formulas and R2 values.
Scatter plots for electricity vs. operating hours and natural gas vs. operating hours. Show the trendlines formulas and R2 values.
Provide a brief evaluation of your conclusion on what is driving electricity and natural gas consumption at the Prince George school.
Estimate the electricity and natural required for heating and cooling at the school.
Briefly comment on what other end-uses are likely using energy at the school beyond heating and cooling.
Briefly comment on the energy consumption at the school when the school is unoccupied. Calculate the Prince George schools Energy Use Intensity (EUI) and compare the school versus other K=12 schools as reported in Portfolio Manager Technical Reference: Canadian National Energy Use Intensity. Use the site EUI as a comparison, not the source EUI.
Briefly comment on why the schools energy use may be higher or lower than the Canadian average.
thanks
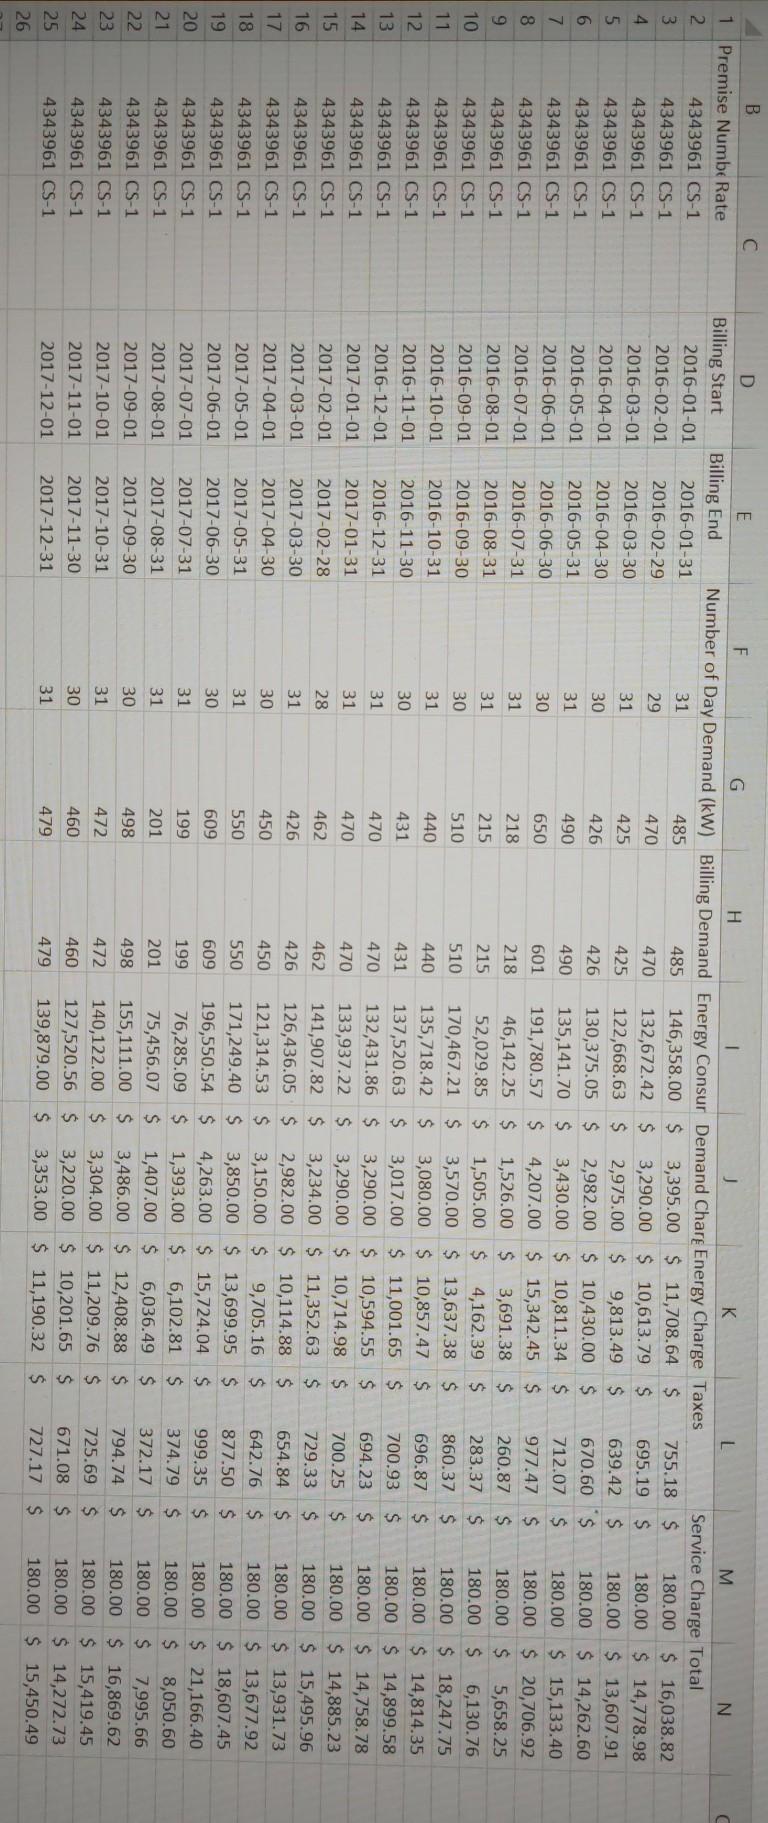
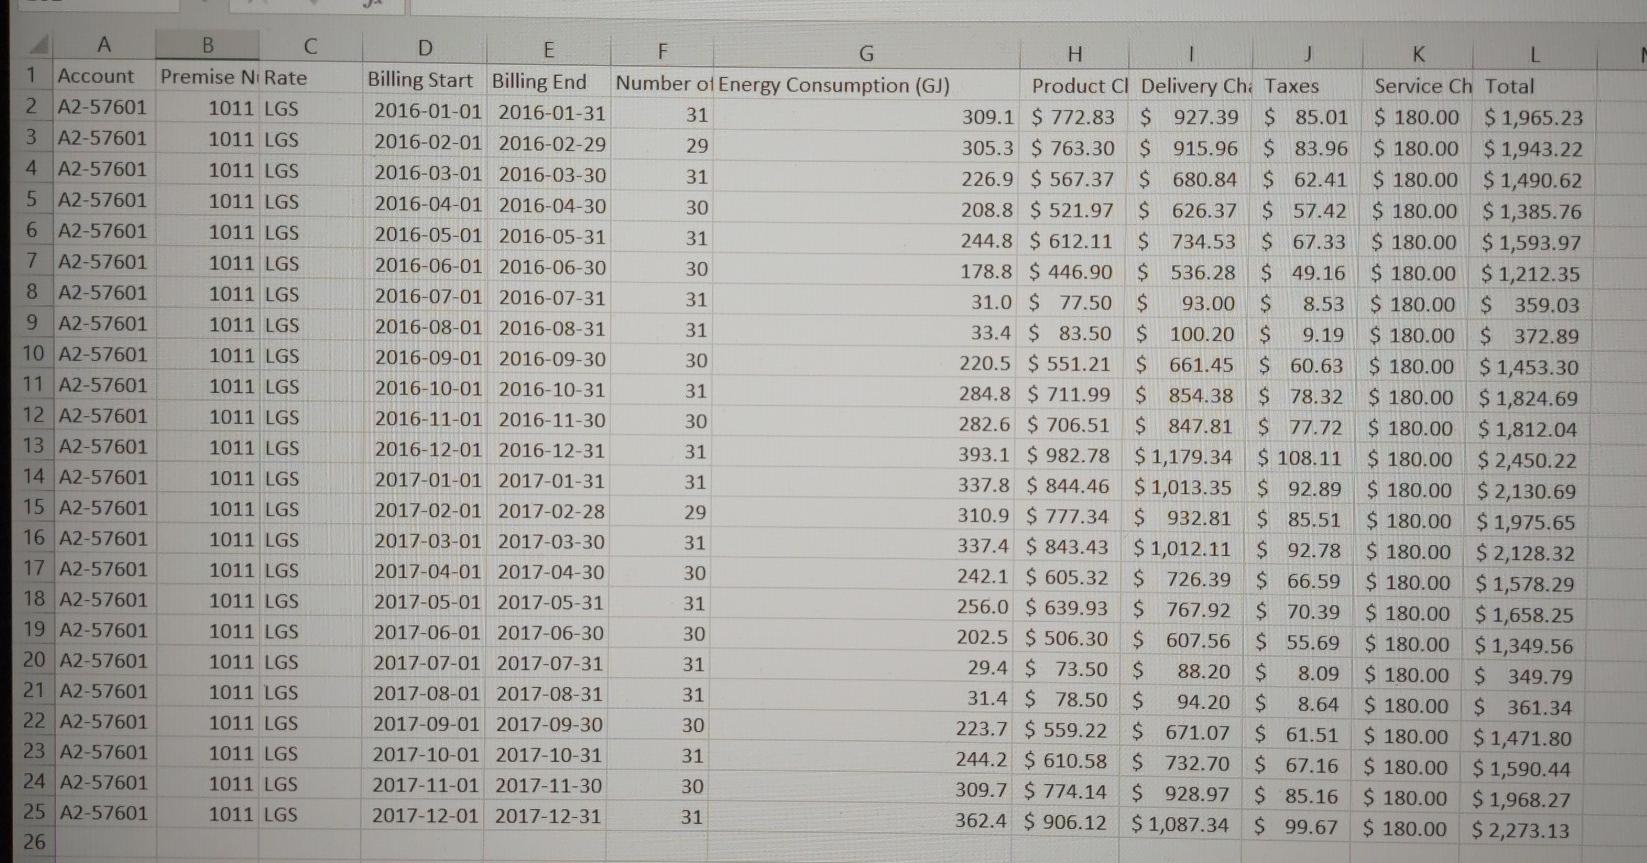
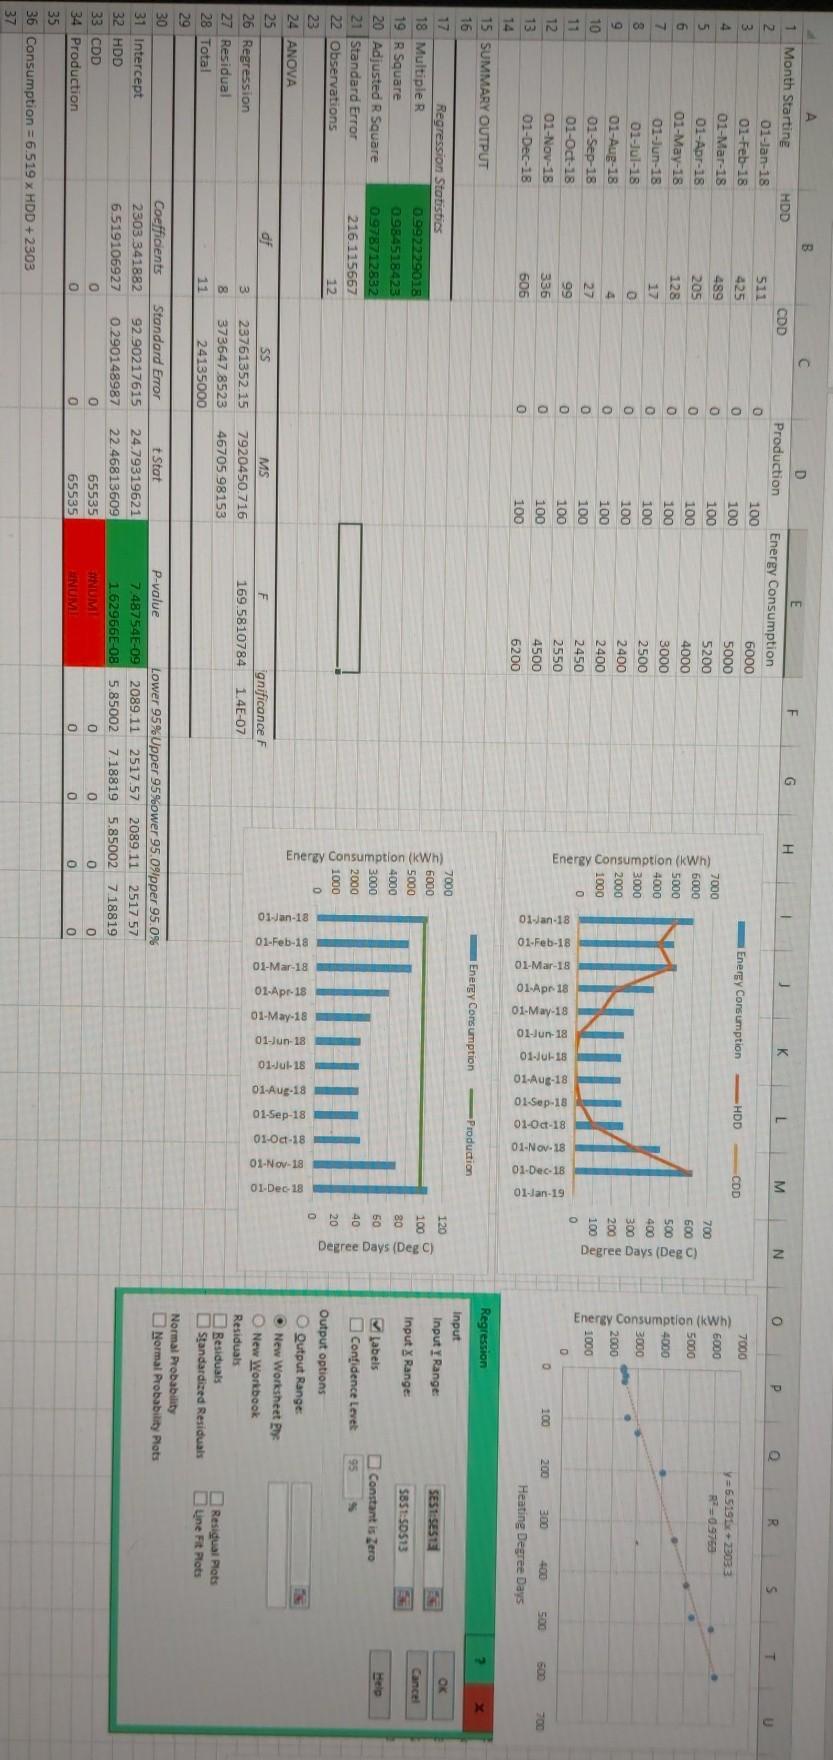
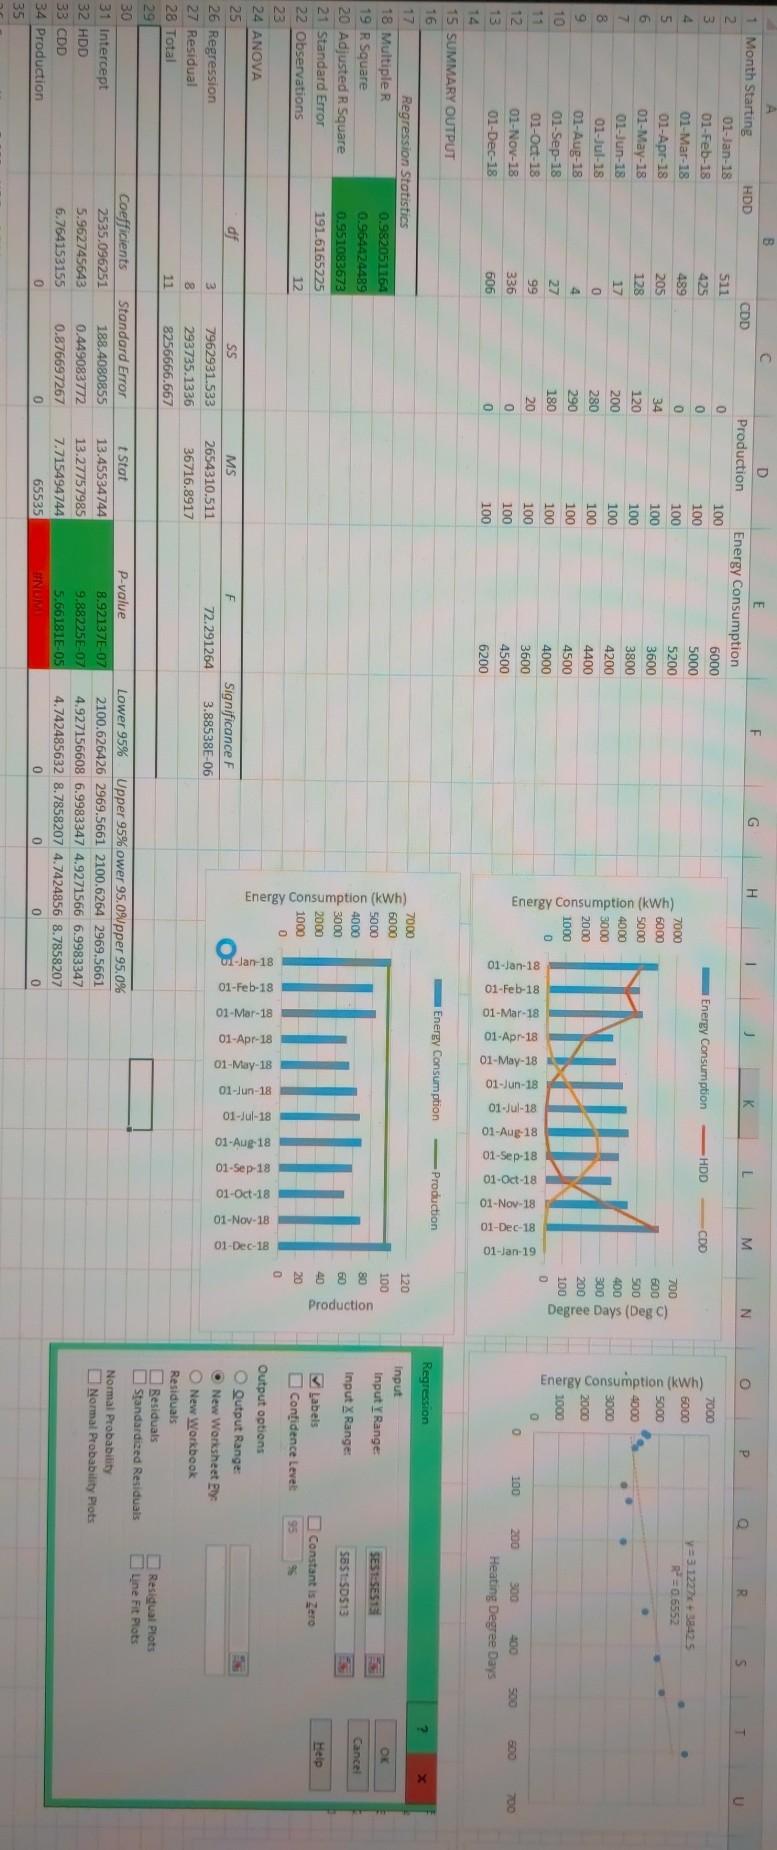
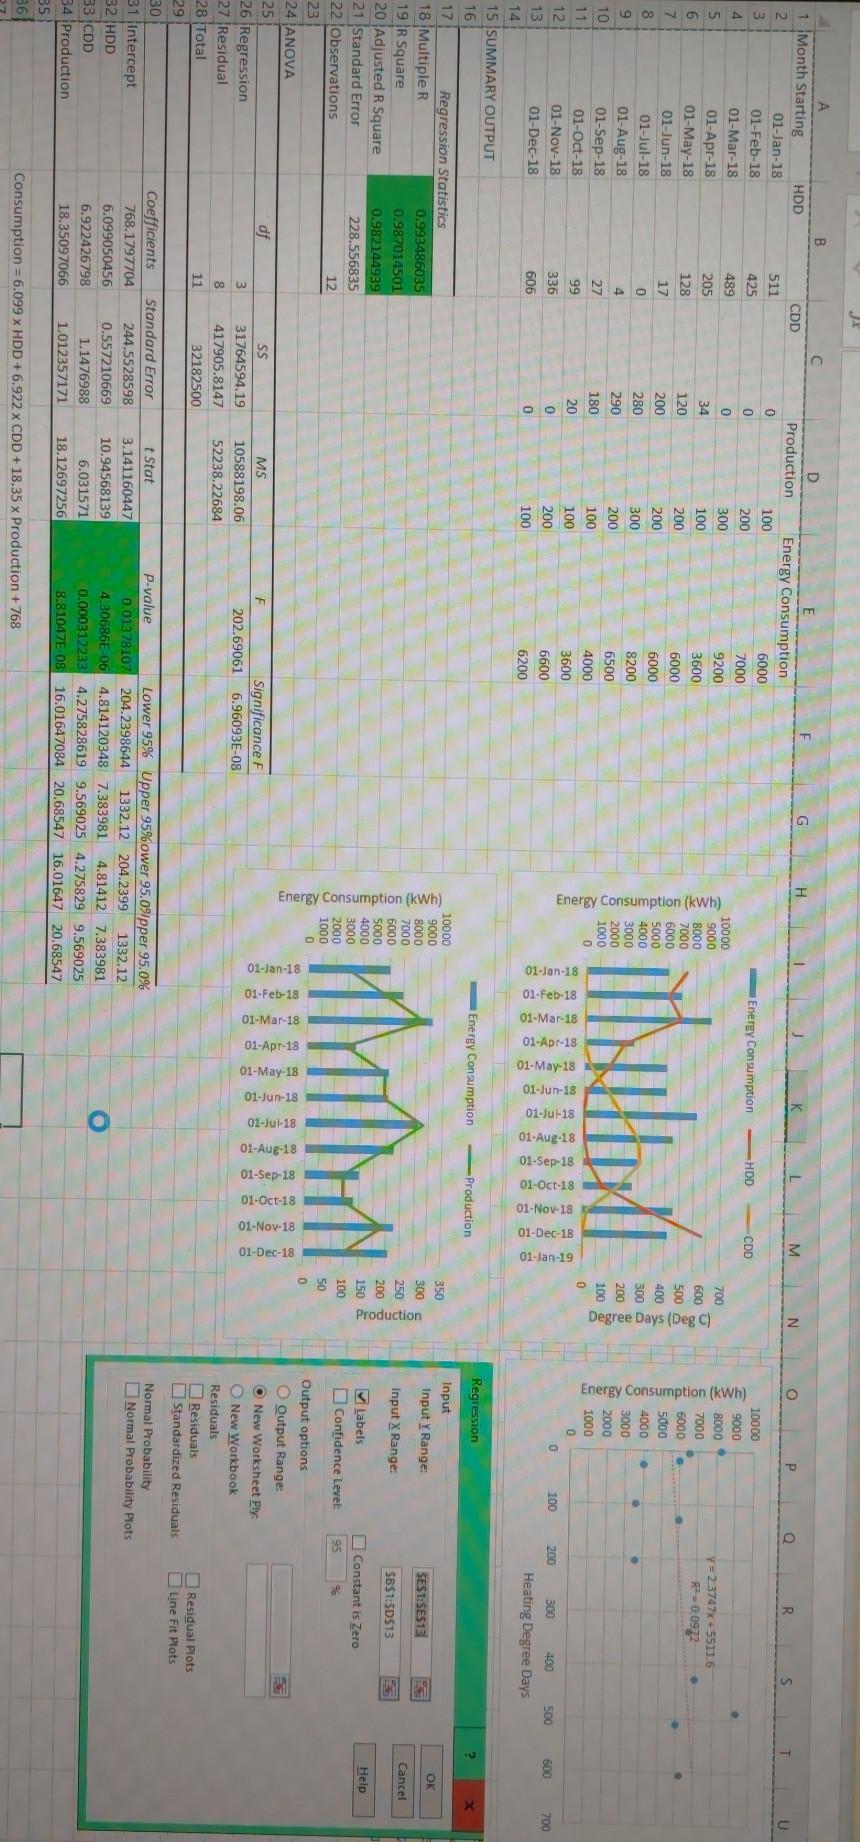
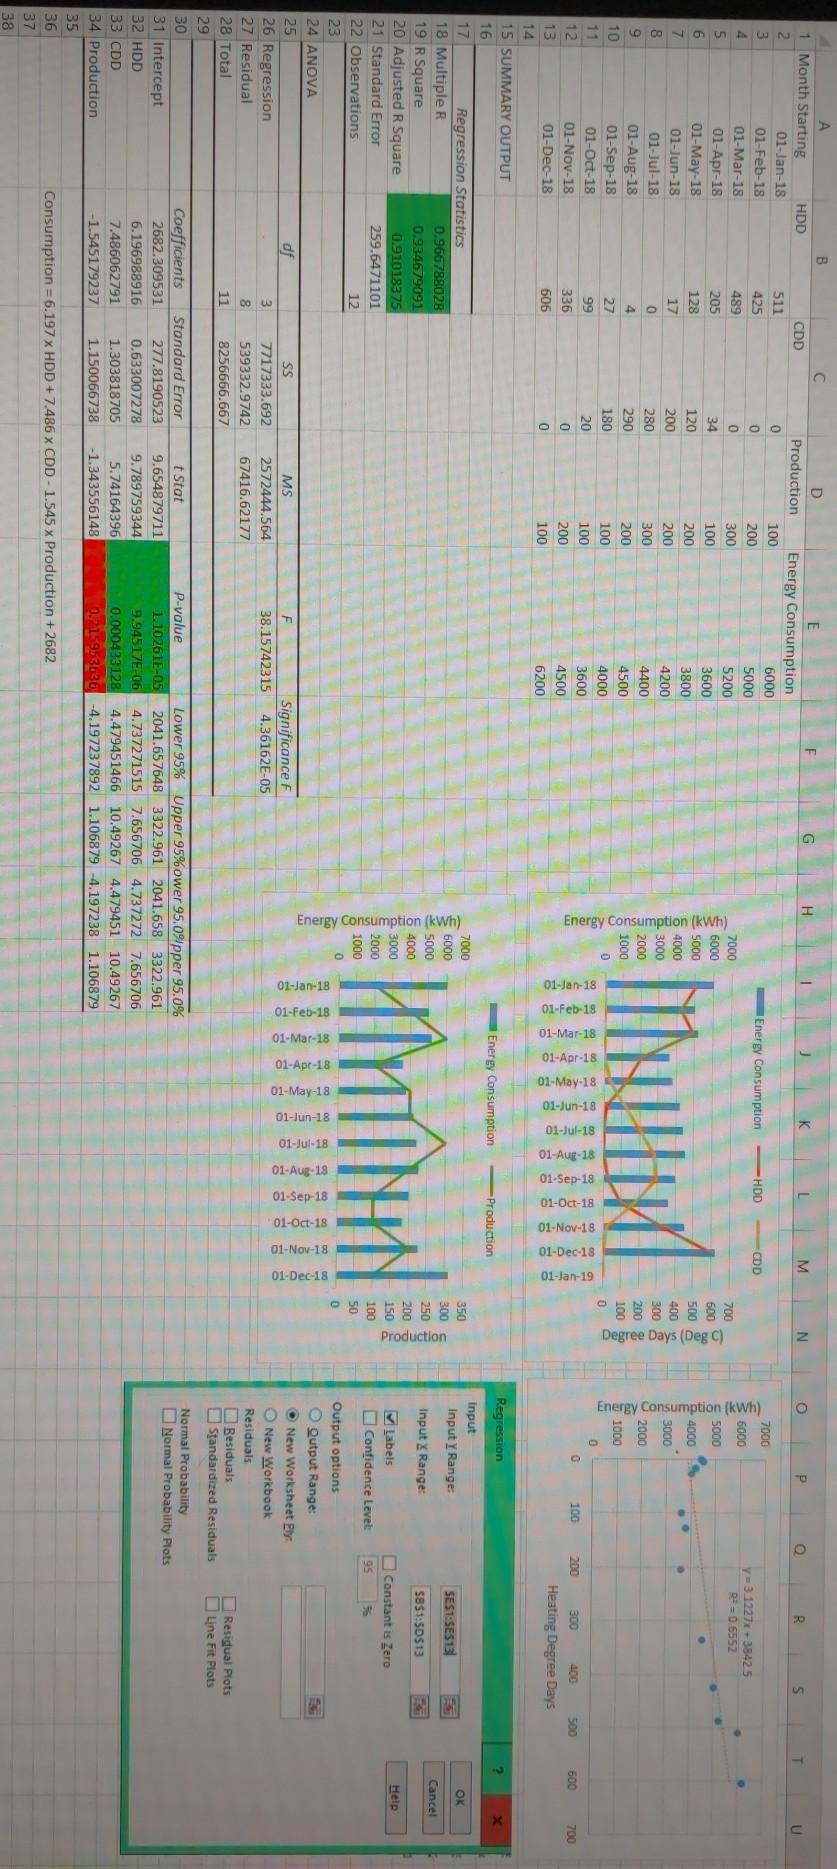
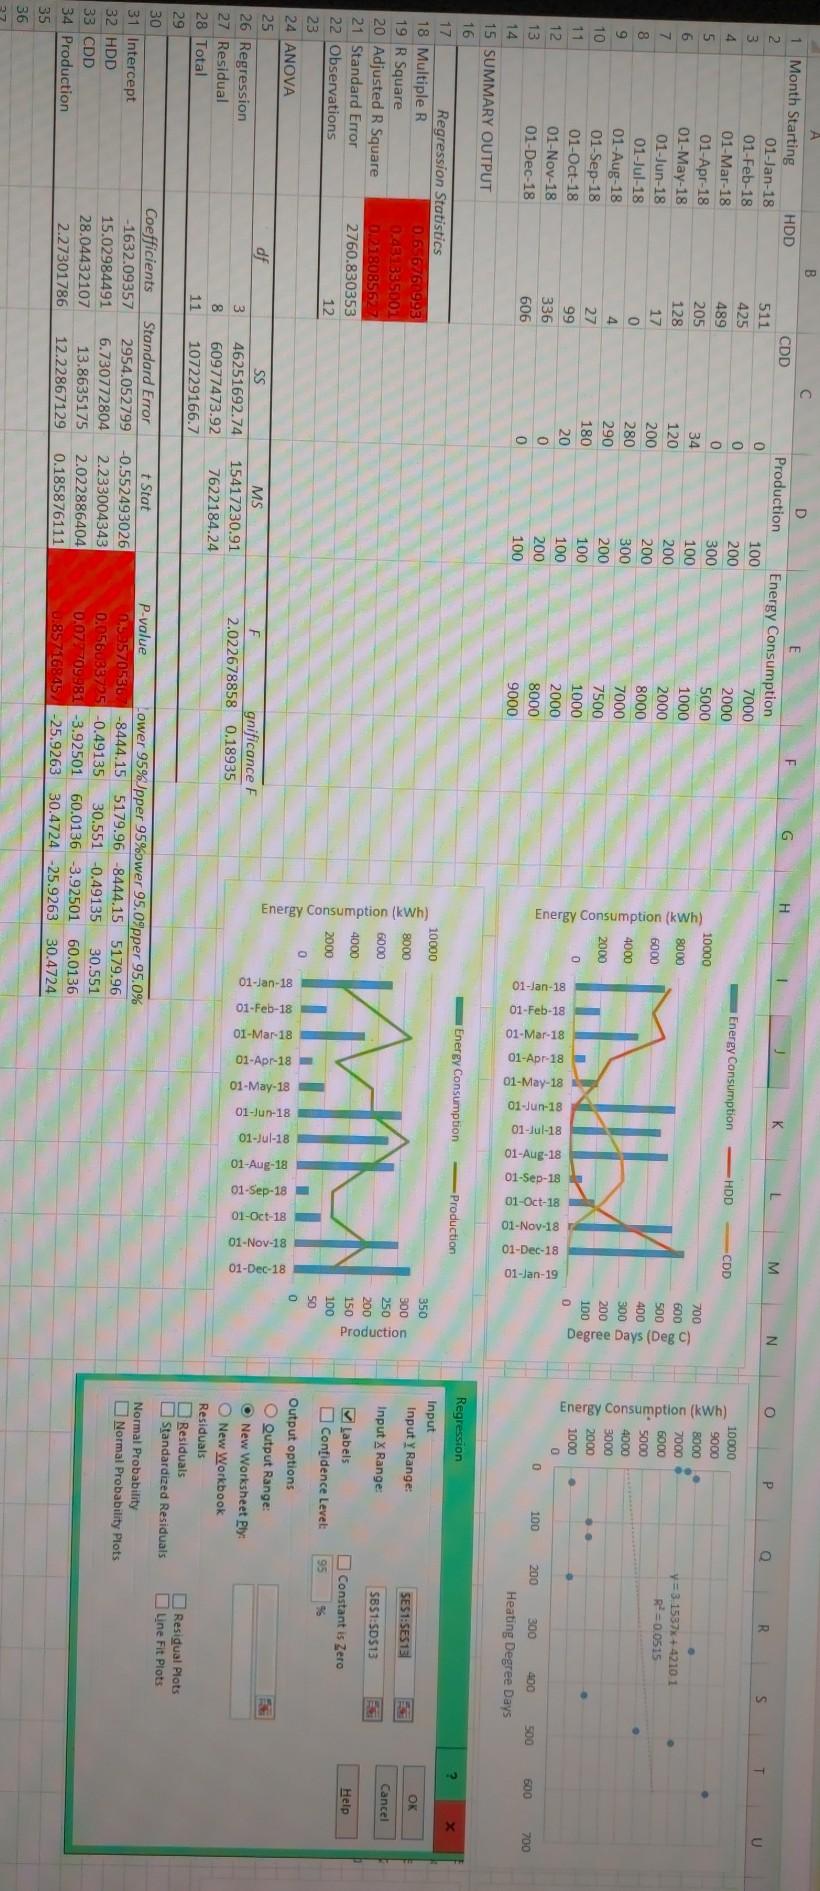
B C 1 Premise Numbe Rate 2. 4343961 CS-1 3 4343961 CS-1 4 4343961 CS-1 5 4343961 CS-1 6 4343961 CS-1 7 4343961 CS-1 8 4343961 CS-1 9 4343961 CS-1 10 4343961 CS-1 11 4343961 CS-1 12. 4343961 CS-1 13 4343961 CS-1 14 4343961 CS-1 15 4343961 CS-1 16 4343961 CS-1 17 4343961 CS-1 18 4343961 CS-1 19 4343961 CS-1 20 4343961 CS-1 21 4343961 CS-1 22 4343961 CS-1 23 4343961 CS-1 24 4343961 CS-1 25 4343961 CS-1 26 D E F H K 1 M N Billing Start Billing End Number of Day Demand (kW) Billing Demand Energy Consur Demand Charg Energy Charge Taxes Service Charge Total 2016-01-01 2016-01-31 31 485 485 146,358.00 $ 3,395.00 $ 11,708.64 $ 755.18 $ 180.00 $ 16,038.82 2016-02-01 2016-02-29 29 470 470 132,672.42 $ 3,290.00 $ 10,613.79 $ 695.19 $ 180.00 $ 14,778.98 2016-03-01 2016-03-30 31 425 425 122,668.63 $ 2,975.00 $ 9,813.49 $ 639.42 $ 180.00 $ 13,607.91 2016-04-01 2016-04-30 30 426 426 130,375.05 S 2,982.00 $ 10,430.00 $ 670.60 $ 180.00 $ 14,262.60 2016-05-01 2016-05-31 31 490 490 135,141.70 $ 3,430.00 $ 10,811.34 $ 712.07 $ 180.00 $ 15,133.40 2016-06-01 2016-06-30 30 650 601 191,780.57 $ 4,207.00 $ 15,342.45 $ 977.47 $ 180.00 $ 20,706.92 2016-07-01 2016-07-31 31 218 218 46,142.25 $ 1,526.00 $ 3,691.38 $ 260.87 $ 180.00 $ 5,658.25 2016-08-01 2016-08-31 31 215 215 52,029.85 $ 1,505.00 $ 4,162.39 $ 283.37 $ 180.00 S 6,130.76 2016-09-01 2016-09-30 30 510 510 170,467.21 $ 3,570.00 $ 13,637.38 $ 860.37 $ 180.00 $ 18,247.75 2016-10-01 2016-10-31 31 440 440 135,718.42 $ 3,080.00 $ 10,857.47 $ 696.87 $ 180.00 $ 14,814.35 2016-11-01 2016-11-30 30 431 431 137,520.63 $ 3,017.00 $ 11,001.65 $ 700.93 $ 180.00 $ 14,899.58 2016-12-01 2016-12-31 31 470 470 132,431.86 $ 3,290.00 $ 10,594.55 $ 694.23 $ 180.00 $ 14,758.78 2017-01-01 2017-01-31 31 470 470 133,937.22 $ 3,290.00 $ 10,714.98 $ 700.25 $ 180.00 $ 14,885.23 2017-02-01 2017-02-28 28 462 141,907.82 $ 3,234.00 $ 11,352.63 $ 729.33 $ 180.00 $ 15,495.96 2017-03-01 2017-03-30 31 426 426 126,436.05 $ 2,982.00 $ 10,114.88 $ 654.84 $ 180.00 $ 13,931.73 2017-04-01 2017-04-30 30 450 121,314.53 $ 3,150.00 $ 9,705.16 $ 642.76 $ 180.00 $ 13,677.92 2017-05-01 2017-05-31 31 550 550 171,249.40 $ 3,850.00 $ 13,699.95 $ 877.50 $ 180.00 $ 18,607.45 2017-06-01 2017-06-30 30 609 609 196,550.54 $ 4,263.00 $ 15,724.04 $ 999.35 $ 180.00 $ 21,166.40 2017-07-01 2017-07-31 31 199 199 76,285.09 $ 1,393.00 $ 6,102.81 $ 374.79 $ 180.00 $ 8,050.60 2017-08-01 2017-08-31 31 201 201 75,456.07 $ 1,407.00 $ 6,036.49 $ 372.17 $ 180.00 $ 7,995.66 2017-09-01 2017-09-30 30 498 498 155,111.00 $ 3,486.00 $ 12,408.88 $ 794.74 $ 180.00 $ 16,869.62 2017-10-01 2017-10-31 31 472 472 140,122.00 $ 3,304.00 $ 11,209.76 $ 725.69 $ 180.00 $ 15,419.45 2017-11-01 2017-11-30 30 460 460 127,520.56 $ 3,220.00 $ 10,201.65 $ 671.08 $ 180.00 $ 14,272.73 2017-12-01 2017-12-31 31 479 479 139,879.00 $ 3,353.00 $ 11,190.32 $ 727.17 $ 180.00 $ 15,450.49 462 450 A B C 1 Account Premise Ni Rate 2 A2-57601 1011 LGS 3 A2-57601 1011 LGS 4 A2-57601 1011 LGS 5 A2-57601 1011 LGS 6 A2-57601 1011 LGS 7 A2-57601 1011 LGS 8 A2-57601 1011 LGS 9 A2-57601 1011 LGS 10 A2-57601 1011 LGS 11 A2-57601 1011 LGS 12 A2-57601 1011 LGS 13 A2-57601 1011 LGS 14 A2-57601 1011 LGS 15 A2-57601 1011 LGS 16 A2-57601 1011 LGS 17 A2-57601 1011 LGS 18 A2-57601 1011 LGS 19 A2-57601 1011 LGS 20 A2-57601 1011 LGS 21 A2-57601 1011 LGS 22 A2-57601 1011 LGS 23 A2-57601 1011 LGS 24 A2-57601 1011 LGS 25 A2-57601 1011 LGS 26 D F G H K L Billing Start Billing End Number of Energy Consumption (GJ) Product Cl Delivery ChTaxes Service Ch Total 2016-01-01 2016-01-31 31 309.1 $ 772.83 $ 927.39 $ 85.01 $ 180.00 $ 1,965.23 2016-02-01 2016-02-29 29 305.3 $ 763.30 $ 915.96 $ 83.96 $ 180.00 $ 1,943.22 2016-03-01 2016-03-30 31 226.9 $ 567.37 $ 680.84 $ 62.41 $ 180.00 $ 1,490.62 2016-04-01 2016-04-30 30 208.8 $ 521.97 $ 626.37 $ 57.42 $ 180.00 $ 1,385.76 2016-05-01 2016-05-31 31 244.8 $ 612.11 $ 734.53 $ 67.33 $ 180.00 $ 1,593.97 2016-06-01 2016-06-30 30 178.8 $ 446.90 $ 536.28 $ 49.16 $ 180.00 $ 1,212.35 2016-07-01 2016-07-31 31 31.0 $ 77.50 $ 93.00 $ 8.53 $ 180.00 $ 359.03 2016-08-01 2016-08-31 31 33.4 $ 83.50 $ 100.20 $ 9.19 $ 180.00 $ 372.89 2016-09-01 2016-09-30 30 220.5 $ 551.21 $ 661.45 $ 60.63 $ 180.00 $ 1,453.30 2016-10-01 2016-10-31 31 284.8 $ 711.99 $ 854.38 $ 78.32 $ 180.00 $ 1,824.69 2016-11-01 2016-11-30 30 282.6 $ 706.51 $ 847.81 $ 77.72 $ 180.00 $ 1,812.04 2016-12-01 2016-12-31 31 393.1 $ 982.78 $ 1,179.34 $ 108.11 $ 180.00 $ 2,450.22 2017-01-01 2017-01-31 31 337.8 $ 844.46 $ 1,013.35 $ 92.89 $ 180.00 $ 2,130.69 2017-02-01 2017-02-28 29 310.9 $ 777.34 $ 932.81 $ 85.51 $ 180.00 $ 1,975.65 2017-03-01 2017-03-30 31 337.4 $ 843.43 $ 1,012.11 $ 92.78 $ 180.00 $ 2,128.32 2017-04-01 2017-04-30 30 242.1 $ 605.32 $ 726.39 $ 66.59 $ 180.00 $1,578.29 2017-05-01 2017-05-31 31 256.0 $ 639.93 $ 767.92 $ 70.39 $ 180.00 $1,658.25 2017-06-01 2017-06-30 30 202.5 $ 506.30 $ 607.56 $ 55.69 $ 180.00 $ 1,349.56 2017-07-01 2017-07-31 31 29.4 $ 73.50 $ 88.20 $ 8.09 $ 180.00 $ 349.79 2017-08-01 2017-08-31 31 31.4 $ 78.50 $ 94.20 $ 8.64 $ 180.00 $ 361.34 2017-09-01 2017-09-30 30 223.7 $ 559.22 $ 671.07 $ 61.51 $ 180.00 $ 1,471.80 2017-10-01 2017-10-31 31 244.2 $ 610.58 $ 732.70 $ 67.16 $ 180.00 $ 1,590.44 2017-11-01 2017-11-30 30 309.7 $ 774.14 $ 928.97 $ 85.16 $ 180.00 $ 1,968.27 2017-12-01 2017-12-31 31 362.4 $ 906.12 $ 1,087.34 $ 99.67 $ 180.00 $2,273.13 G H K K L M A B D E F 1 Start Date End Date Occupied (Comments 2 2016-01-01 2016-01-31 241 3 2016-02-01 2016-02-29 256 4 2016-03-01 2016-03-30 245 5 2016-04-01 2016-04-30 249 6 2016-05-01 2016-05-31 252 7 2016-06-01 2016-06-30 31 Mostly unoccupied during summer 8 2016-07-01 2016-07-31 39 Mostly unoccupied during summer 9 2016-08-01 2016-08-31 251 10 2016-09-01 2016-09-30 271 11 2016-10-01 2016-10-31 255 12 2016-11-01 2016-11-30 252 13 2016-12-01 2016-12-31 218 Short christmas break 14 2017-01-01 2017-01-31 220 15 2017-02-01 2017-02-28 265 16 2017-03-01 2017-03-30 244 17 2017-04-01 2017-04-30 249 18 2017-05-01 2017-05-31 248 19 2017-06-01 2017-06-30 45 Mostly unoccupied during summer 20 2017-07-01 2017-07-31 32 Mostly unoccupied during summer 21 2017-08-01 2017-08-31 249 22 2017-09-01 2017-09-30 253 23 2017-10-01 2017-10-31 246 24 2017-11-01 2017-11-30 270 25 2017-12-01 2017-12-31 218 Short christmas break L M N 0 B S Nm HDD CDD 7000 6000 y = 6.5191 +23033 R*0.9753 5000 5000 700 600 500 400 4000 Energy Consumption (kWh) Energy Consumption (kWh) 3000 300 200 100 Degree Days (Deg 2000 1000 01 Jan-18 01-Feb-18 01-Mar-18 8T TO 0 0 81-unto 01-May-18 100 01-01-18 01-Aug-18 01-Sep-18 01-Oct-18 01-Nov. 18 01-Dec-18 01-Jan-19 200 SO 700 606 300 500 Heating Degree Days Regression 2 -Production 120 Input Input Y Range: OK SES1-55913 100 Cancel B C D 1 Month Starting G H HDD COD Production K Energy Consumption 01-Jan-18 511 100 6000 01-Feb-18 425 0 100 - Energy Consumption 4 5000 01-Mar-18 489 0 100 7000 5 5200 01-Apr-18 205 6000 100 4000 6 01-May-18 128 0 100 7 3000 01-Jun-18 4000 17 0 100 2500 8 3000 01-Jul-18 100 2400 2000 01-Aug-18 4 0 100 2400 1000 10 01-Sep-18 27 0 100 2450 0 11 01-Oct-18 99 0 100 2550 12 01-Nov-18 336 0 100 4500 13 01-Dec-18 0 100 6200 14 15 SUMMARY OUTPUT Energy Consumption 16 7000 17 Regression Statistics 6000 18 Multiple R 0.992229018 5000 19 R Square 0.984518423 84000 20 Adjusted R Square 0978712832 3000 21 Standard Error 2000 216.115667 22 Observations 12 0 23 24 ANOVA 25 SS MS F ignificance F 26 Regression 3 23761352 15 7920450.716 169.5810784 1.4E-07 27 Residual 8 373647 8523 46705.98153 28 Total 24135000 29 30 Coefficients Standard Error t Stat P-value Lower 95% Upper 95%ower 95.09 pper 95.096 31 Intercept 2303.341882 92.90217615 24.79319621 7:48754E-09 2089.11 2517.57 2089.11 2517 57 32 HDD 6.519106927 0.290148987 22.46813609 1.62966E-08 5.85002 7.18819 5.85002 718819 33 CDD 0 65535 NUMI 0 0 0 0 34 Production 0 65535 NUM 0 0 0 0 35 36 Consumption = 6.519 x HDD +2303 37 Input X Range 5851:50513 80 Energy Consumption (kWh) Degree Days (Deg C) Labels Confidence Leve Constant is Zero os 40 1000 01-Jan-18 01-Feb-18 01-Mar-18 - 01-Apr-18 01-May-18 - 01-Jun-18 01-01-18 01-Aug-18 01-Sep-18 - 01-04-18 - 01-Nov-18 - 01 Dec 18 - Output options O Qutput Range New Worksheet New Workbook Residuals Residuals Standardized Residuals Residual Plots ne Fit Plots Normal Probability Normal Probability Plots F G 1 L M N P R S T -Nm & in 7000 -Energy Consumption - HDD CDD 6000 y=31227 +38425 R=06552 700 600 5000 7000 6000 5000 4000 3000 500 4000 . 400 Energy Consumption (kWh) LILLE 3000 300 200 100 2000 1000 2000 1000 4000 0 - 01-Jan-18 01-Feb-10 01-Mar-18 8T-ur-to 100 01-Oct-18 01-Dec-18 01-Jan-19 500 700 200 300 100 500 Heating Degree Days Energy Consumption Production Regression ? B 1 Month Starting HDD CDD Production Energy Consumption 01-Jan-18 511 0 100 6000 01-Feb-18 425 0 100 5000 01-Mar-18 489 0 100 5200 5 01-Apr-18 205 34 100 3600 6 01-May-18 128 120 100 3800 7 01-Jun-18 17 200 100 4200 8 01-Jul-18 0 280 100 4400 9 01-Aug-18 4 290 100 4500 10 01-Sep-18 27 180 100 01-Oct-18 99 20 100 3600 12 01-Nov-18 336 0 100 4500 13 01-Dec-18 606 0 100 6200 14 15 SUMMARY OUTPUT 16 17 Regression Statistics 18 Multiple R 0.982051164 19 R Square 0.964424489 20 Adjusted R Square 0.951083673 21 Standard Error 191.5165225 22 Observations 12 23 24 ANOVA 25 df SS MS F 26 Regression 3 7962931.533 2654310.511 72.291264 27 Residual 8 293735.1336 36716.8917 28 Total 11 8256666.667 29 30 Coefficients Standard Error Stat P-value 31 Intercept 2535.096251 188.4080855 13.45534744 8.92137E-07 32 HDD 5.962745643 0.449083772 13.27757985 9.88225E-07 33 CDD 6.764153155 0.876697267 7.715494744 5.66181E-05 34 Production 0 0 65535 INOM 35 7000 6000 5000 4000 120 100 Input Input Y Range SESSE513 80 Cancel Input X Range 60 3000 555533 Production Energy Consumption (kWh) Constant is zero Help 2000 1000 0 Labels Confidence Level 95 OlJan-18 01-Feb-18 01-Mar-18 01-Apr-18 01-May-18 01-Jun-18 01-Jul-18 - 01-Aue-18 01-Sep-18 - 01-Oct-18 - 01-Nov-18 - 01-Dec-18 Significance F 3.88538E-06 Output options Qutput Range New Worksheet Ely New Workbook Residuals Residuals Standardized Residuals Residual Plats Line Fit Plats Normal Probability E Normal Probability Plots Lower 95% Upper 95% ower 95.0%pper 95.0% 2100.626426 2969.5661 2100.6264 2969.5661 4.927156608 6.9983347 4.9271566 6.9983347 4.742485632 8.7858207 4.7424856 8.7858207 0 0 0 0 JAU M N P Q U Energy Consumption - HDD CDD 700 600 10000 9000 8000 7000 6000 5000 y=23747x - 55116 R0,0972 500 Energy Consumption (kWh) 400 300 200 100 Energy Consumption (kWh Degree Days (DegC) 4000 4000 3000 2000 1000 0 0 0 - 01-Jan-18 01-Feb-18 01-Mar-18 01-Apr-18 01-May-18 01-Jun-18 01-Jul-18 01-Aug-18 01-Sep-18 100 01-Nov-18 01-Dec-18 01-Jan-19 200 600 700 300 400 500 Heating Degree Days Energy Consumption - Production Regression ? x Input B 1 Month Starting G H HDD CDD Production Energy Consumption 2. 01-Jan-18 511 0 100 6000 3 01-Feb-18 425 0 200 7000 4 01-Mar-18 489 0 10000 300 9200 5 9000 01-Apr-18 205 34 100 3600 8000 6 01-May-18 128 120 7000 200 6000 7 6000 01-Jun-18 17 200 200 6000 5000 8 01-Jul-18 0 4000 280 300 8200 3000 9 01-Aug-18 4. 290 200 2000 6500 1000 10 01-Sep-18 27 180 100 0 11 01-Oct-18 99 20 100 3600 12 01-Nov-18 336 0 200 6600 13 01-Dec-18 606 0 100 6200 14 15 SUMMARY OUTPUT 16 10000 17 Regression Statistics 9000 18 Multiple R 0.993486035 8000 7000 19 R Square 0.987014501 20 Adjusted R Square 5000 0.982144939 4000 21 Standard Error 228.556835 3000 2000 22 Observations 12 1000 23 0 24 ANOVA 25 df SS MS F Significance F 26 Regression 3 31764594.19 10588198.06 202.69061 6.96093E-08 27 Residual 8 417905.8147 52238.22684 28 Total 11 32182500 29 30 Coefficients Standard Error t Stat P-value Lower 95% Upper 95% ower 95.09|pper 95.0% 31 Intercept 768.1797704 244.5528598 3.141160447 0.01378107 204.2398644 1332.12 204.2399 1332.12 32 HDD 6.099050456 0.557210669 10.94568139 4.30686E-06 4.814120348 7.383981 4.81412 7.383981 33 CDD 6.922426798 1.1476988 6.031571 0.000312233 4.275828619 9.569025 4.275829 9.569025 34 Production 18.35097066 1.012357171 18.12697256 8.81047E-08 16.01647084 20.68547 16.01647 20.68547 35 36 Consumption = 6.099 x HDD +6.922 x CDD +18.35 x Production + 768 OK Input Y Range SES1:SE$131 350 300 250 200 150 Cancel 6000 Production Input X Range: $B$1:50513 Help Labels Confidence Level: Constant is Zero 95 100 50 BT-uerto 01-Feb-18 01-Mar-18 01-Nov-18 01-Dec-18 Output options O Output Range New Worksheet Ply: New Workbook Residuals Residuals Standardized Residuals Residual Plots Line Fit Plots Normal Probability Normal Probability Piots o O O N O P R S 7000 6000 y = 3.1227x + 38425 R = 0.6552 5000 4000 700 600 500 400 300 200 100 Energy Consumption (kWh) Degree Days (Deg C) Energy Consumption (kWh) 3000 2000 1000 0 0 0 100 200 01-Aug-18 01-Sep-18 01-Jan-18 01-Feb-18 01-Mar-18 01-Apr-18 01-May-18 6T-ver-to 700 600 01-Nov-19 01-Dec-18 300 400 500 Heating Degree Days Regression 2 X Input Input Y Range OK 6000 SEST:SE513 Cancel A B E 1 Month Starting F G H HDD CDD M Production Energy Consumption 2 01-Jan-18 511 0 100 6000 3 01-Feb-18 425 0 200 Energy Consumption - HDD CDD 5000 01-Mar-18 489 0 300 5200 7000 5 01-Apr-18 205 34 100 6000 3600 6 01-May-18 128 120 5000 200 3800 7 01-Jun-18 17 4000 200 200 4200 8 3000 01-Jul-18 0 280 300 4400 2000 9 01-Aug-18 4 290 200 4500 1000 10 01-Sep-18 27 180 100 4000 0 11 01-Oct-18 99 20 100 3600 12 01-NOV-18 336 0 200 4500 13 01-Dec-18 606 0 100 6200 14 15 SUMMARY OUTPUT Energy Consumption - Production 16 17 Regression Statistics 7000 18 Multiple R 0.966788028 5000 19 R Square 0.934679091 4000 20 Adjusted R Square 0.91018375 3000 21 Standard Error 259.6471101 2000 22 Observations 12 1000 0 23 24 ANOVA 25 df SS MS F Significance F 26 Regression 3 7717333.692 2572444.564 38.15742315 4.36162E-05 27 Residual 8 539332.9742 67416.62177 28 Total 11 8256666.667 29 30 Coefficients Standard Error t Stat P-value Lower 95% Upper 95%ower 95.09 pper 95.0% 31 Intercept 2682.309531 277.8190523 9.654879711 1.10261E-05 2041.657648 3322.961 2041.658 3322.961 32 HDD 6.196988916 0.633007278 9.789759344 9.94517E-06 4.737271515 7.656706 4.737272 7.656706 33 CDD 7.486062791 1.303818705 5.74164396 0.000433128 4.479451466 10.49267 4.479451 10.49267 34 Production -1.545179237 1.150066738 -1.343556148 0215953630 -4.197237892 1.106879 -4.197238 1.106879 35 36 Consumption = 6.197 x HDD +7.486 x CDD - 1.545 x Production +2682 37 38 Input X Range: S8$1:$D$13 Production HIMNI 350 300 250 200 150 100 50 Labels Energy Consumption (kWh) Help Constant is Zero 95 Confidence Level: 01-Jan-18 01-Feb-18 01-Mar-18 01-Apr-18 01-May-18 -- 01-Oct-18 01-Nov-18 01-Dec-18 Output options Qutput Range New Worksheet Ply: New Workbook Residuals Besiduals Standardized Residuals Resigual Plots Line Fit Plots Normal Probability Normal Probability Plots M N 0 R S U HDD CDD y = 3-1537x +42101 R = 0.0515 200 En III 700 600 500 400 300 200 100 Degree Days (Deg C) Energy Consumption (kWh) 10000 9000 8000 7000 6000 5000 4000 3000 2000 1000 0 2000 336 01-Jan-18 01-Mar-18 01-Apr-18 01-Nov-18 01-Dec-18 01-Jan-19 100 600 700 200 300 400 500 Heating Degree Days -Production Regression D 1 Month Starting F H HDD 1 CDD Production 2 01-Jan-18 Energy Consumption 511 100 3 01-Feb-18 7000 425 0 200 Energy Consumption 4 01-Mar-18 2000 489 0 300 5 5000 10000 01-Apr-18 205 34 100 6 1000 8000 01-May-18 128 120 200 7 2000 01-Jun-18 6000 17 200 8000 8 01-Jul-18 0 280 4000 300 7000 9 01-Aug-18 4 290 200 7500 10 01-Sep-18 27 180 100 1000 11 01-Oct-18 99 20 100 2000 12 01-Nov-18 0 200 8000 13 01-Dec-18 606 0 100 9000 14 15 SUMMARY OUTPUT 16 Energy Consumption 17 Regression Statistics 10000 18 Multiple R 0.6 6760993 8000 19 R Square 0E1B35001 6000 20 Adjusted R Square 01218085627 4000 21 Standard Error 2760.830353 2000 22 Observations 12. 23 0 24 ANOVA 25 df SS MS gnificance F 26 Regression 3 46251692.74 15417230.91 2.022678858 0.18935 27 Residual 8 60977473.92 7622184.24 28 Total 11 107229166.7 29 30 Coefficients Standard Error t Stat P-value Lower 95%Jpper 95%ower 95.0%pper 95.0% 31 Intercept -1632.09357 2954.052799 -0.552493026 3570536 -8444.15 5179.96 -8444.15 5179.96 32 HDD 15.02984491 6.730772804 2.233004343 0.056033725 -0.49135 30.551 -0.49135 30.551 33 CDD 28.04432107 13.8635175 2.022886404 0.079709981 -3.92501 60.0136 3.92501 60.0136 34 Production 2.27301786 12.22867129 0.185876111 3.857116845 -25.9263 30.4724 -25.9263 30.4724 35 36 Input Input Y Range: OK SE51:SES13 Cancel Input X Range 350 300 250 200 150 100 so Production n $B$1:$D$13 Constant is Zero Help Labels Confidence Level: 0 01-Jan-18 01-Apr-18 01-Jun-18 -- 01-Jul-18 01-Nov-18 01-Dec-18 Output options Qutput Range: New Worksheet Ply: New Workbook Residuals Residuals Standardized Residuals Residual Plats Une Fit Plots Normal Probability Normal Probability Plots B C 1 Premise Numbe Rate 2. 4343961 CS-1 3 4343961 CS-1 4 4343961 CS-1 5 4343961 CS-1 6 4343961 CS-1 7 4343961 CS-1 8 4343961 CS-1 9 4343961 CS-1 10 4343961 CS-1 11 4343961 CS-1 12. 4343961 CS-1 13 4343961 CS-1 14 4343961 CS-1 15 4343961 CS-1 16 4343961 CS-1 17 4343961 CS-1 18 4343961 CS-1 19 4343961 CS-1 20 4343961 CS-1 21 4343961 CS-1 22 4343961 CS-1 23 4343961 CS-1 24 4343961 CS-1 25 4343961 CS-1 26 D E F H K 1 M N Billing Start Billing End Number of Day Demand (kW) Billing Demand Energy Consur Demand Charg Energy Charge Taxes Service Charge Total 2016-01-01 2016-01-31 31 485 485 146,358.00 $ 3,395.00 $ 11,708.64 $ 755.18 $ 180.00 $ 16,038.82 2016-02-01 2016-02-29 29 470 470 132,672.42 $ 3,290.00 $ 10,613.79 $ 695.19 $ 180.00 $ 14,778.98 2016-03-01 2016-03-30 31 425 425 122,668.63 $ 2,975.00 $ 9,813.49 $ 639.42 $ 180.00 $ 13,607.91 2016-04-01 2016-04-30 30 426 426 130,375.05 S 2,982.00 $ 10,430.00 $ 670.60 $ 180.00 $ 14,262.60 2016-05-01 2016-05-31 31 490 490 135,141.70 $ 3,430.00 $ 10,811.34 $ 712.07 $ 180.00 $ 15,133.40 2016-06-01 2016-06-30 30 650 601 191,780.57 $ 4,207.00 $ 15,342.45 $ 977.47 $ 180.00 $ 20,706.92 2016-07-01 2016-07-31 31 218 218 46,142.25 $ 1,526.00 $ 3,691.38 $ 260.87 $ 180.00 $ 5,658.25 2016-08-01 2016-08-31 31 215 215 52,029.85 $ 1,505.00 $ 4,162.39 $ 283.37 $ 180.00 S 6,130.76 2016-09-01 2016-09-30 30 510 510 170,467.21 $ 3,570.00 $ 13,637.38 $ 860.37 $ 180.00 $ 18,247.75 2016-10-01 2016-10-31 31 440 440 135,718.42 $ 3,080.00 $ 10,857.47 $ 696.87 $ 180.00 $ 14,814.35 2016-11-01 2016-11-30 30 431 431 137,520.63 $ 3,017.00 $ 11,001.65 $ 700.93 $ 180.00 $ 14,899.58 2016-12-01 2016-12-31 31 470 470 132,431.86 $ 3,290.00 $ 10,594.55 $ 694.23 $ 180.00 $ 14,758.78 2017-01-01 2017-01-31 31 470 470 133,937.22 $ 3,290.00 $ 10,714.98 $ 700.25 $ 180.00 $ 14,885.23 2017-02-01 2017-02-28 28 462 141,907.82 $ 3,234.00 $ 11,352.63 $ 729.33 $ 180.00 $ 15,495.96 2017-03-01 2017-03-30 31 426 426 126,436.05 $ 2,982.00 $ 10,114.88 $ 654.84 $ 180.00 $ 13,931.73 2017-04-01 2017-04-30 30 450 121,314.53 $ 3,150.00 $ 9,705.16 $ 642.76 $ 180.00 $ 13,677.92 2017-05-01 2017-05-31 31 550 550 171,249.40 $ 3,850.00 $ 13,699.95 $ 877.50 $ 180.00 $ 18,607.45 2017-06-01 2017-06-30 30 609 609 196,550.54 $ 4,263.00 $ 15,724.04 $ 999.35 $ 180.00 $ 21,166.40 2017-07-01 2017-07-31 31 199 199 76,285.09 $ 1,393.00 $ 6,102.81 $ 374.79 $ 180.00 $ 8,050.60 2017-08-01 2017-08-31 31 201 201 75,456.07 $ 1,407.00 $ 6,036.49 $ 372.17 $ 180.00 $ 7,995.66 2017-09-01 2017-09-30 30 498 498 155,111.00 $ 3,486.00 $ 12,408.88 $ 794.74 $ 180.00 $ 16,869.62 2017-10-01 2017-10-31 31 472 472 140,122.00 $ 3,304.00 $ 11,209.76 $ 725.69 $ 180.00 $ 15,419.45 2017-11-01 2017-11-30 30 460 460 127,520.56 $ 3,220.00 $ 10,201.65 $ 671.08 $ 180.00 $ 14,272.73 2017-12-01 2017-12-31 31 479 479 139,879.00 $ 3,353.00 $ 11,190.32 $ 727.17 $ 180.00 $ 15,450.49 462 450 A B C 1 Account Premise Ni Rate 2 A2-57601 1011 LGS 3 A2-57601 1011 LGS 4 A2-57601 1011 LGS 5 A2-57601 1011 LGS 6 A2-57601 1011 LGS 7 A2-57601 1011 LGS 8 A2-57601 1011 LGS 9 A2-57601 1011 LGS 10 A2-57601 1011 LGS 11 A2-57601 1011 LGS 12 A2-57601 1011 LGS 13 A2-57601 1011 LGS 14 A2-57601 1011 LGS 15 A2-57601 1011 LGS 16 A2-57601 1011 LGS 17 A2-57601 1011 LGS 18 A2-57601 1011 LGS 19 A2-57601 1011 LGS 20 A2-57601 1011 LGS 21 A2-57601 1011 LGS 22 A2-57601 1011 LGS 23 A2-57601 1011 LGS 24 A2-57601 1011 LGS 25 A2-57601 1011 LGS 26 D F G H K L Billing Start Billing End Number of Energy Consumption (GJ) Product Cl Delivery ChTaxes Service Ch Total 2016-01-01 2016-01-31 31 309.1 $ 772.83 $ 927.39 $ 85.01 $ 180.00 $ 1,965.23 2016-02-01 2016-02-29 29 305.3 $ 763.30 $ 915.96 $ 83.96 $ 180.00 $ 1,943.22 2016-03-01 2016-03-30 31 226.9 $ 567.37 $ 680.84 $ 62.41 $ 180.00 $ 1,490.62 2016-04-01 2016-04-30 30 208.8 $ 521.97 $ 626.37 $ 57.42 $ 180.00 $ 1,385.76 2016-05-01 2016-05-31 31 244.8 $ 612.11 $ 734.53 $ 67.33 $ 180.00 $ 1,593.97 2016-06-01 2016-06-30 30 178.8 $ 446.90 $ 536.28 $ 49.16 $ 180.00 $ 1,212.35 2016-07-01 2016-07-31 31 31.0 $ 77.50 $ 93.00 $ 8.53 $ 180.00 $ 359.03 2016-08-01 2016-08-31 31 33.4 $ 83.50 $ 100.20 $ 9.19 $ 180.00 $ 372.89 2016-09-01 2016-09-30 30 220.5 $ 551.21 $ 661.45 $ 60.63 $ 180.00 $ 1,453.30 2016-10-01 2016-10-31 31 284.8 $ 711.99 $ 854.38 $ 78.32 $ 180.00 $ 1,824.69 2016-11-01 2016-11-30 30 282.6 $ 706.51 $ 847.81 $ 77.72 $ 180.00 $ 1,812.04 2016-12-01 2016-12-31 31 393.1 $ 982.78 $ 1,179.34 $ 108.11 $ 180.00 $ 2,450.22 2017-01-01 2017-01-31 31 337.8 $ 844.46 $ 1,013.35 $ 92.89 $ 180.00 $ 2,130.69 2017-02-01 2017-02-28 29 310.9 $ 777.34 $ 932.81 $ 85.51 $ 180.00 $ 1,975.65 2017-03-01 2017-03-30 31 337.4 $ 843.43 $ 1,012.11 $ 92.78 $ 180.00 $ 2,128.32 2017-04-01 2017-04-30 30 242.1 $ 605.32 $ 726.39 $ 66.59 $ 180.00 $1,578.29 2017-05-01 2017-05-31 31 256.0 $ 639.93 $ 767.92 $ 70.39 $ 180.00 $1,658.25 2017-06-01 2017-06-30 30 202.5 $ 506.30 $ 607.56 $ 55.69 $ 180.00 $ 1,349.56 2017-07-01 2017-07-31 31 29.4 $ 73.50 $ 88.20 $ 8.09 $ 180.00 $ 349.79 2017-08-01 2017-08-31 31 31.4 $ 78.50 $ 94.20 $ 8.64 $ 180.00 $ 361.34 2017-09-01 2017-09-30 30 223.7 $ 559.22 $ 671.07 $ 61.51 $ 180.00 $ 1,471.80 2017-10-01 2017-10-31 31 244.2 $ 610.58 $ 732.70 $ 67.16 $ 180.00 $ 1,590.44 2017-11-01 2017-11-30 30 309.7 $ 774.14 $ 928.97 $ 85.16 $ 180.00 $ 1,968.27 2017-12-01 2017-12-31 31 362.4 $ 906.12 $ 1,087.34 $ 99.67 $ 180.00 $2,273.13 G H K K L M A B D E F 1 Start Date End Date Occupied (Comments 2 2016-01-01 2016-01-31 241 3 2016-02-01 2016-02-29 256 4 2016-03-01 2016-03-30 245 5 2016-04-01 2016-04-30 249 6 2016-05-01 2016-05-31 252 7 2016-06-01 2016-06-30 31 Mostly unoccupied during summer 8 2016-07-01 2016-07-31 39 Mostly unoccupied during summer 9 2016-08-01 2016-08-31 251 10 2016-09-01 2016-09-30 271 11 2016-10-01 2016-10-31 255 12 2016-11-01 2016-11-30 252 13 2016-12-01 2016-12-31 218 Short christmas break 14 2017-01-01 2017-01-31 220 15 2017-02-01 2017-02-28 265 16 2017-03-01 2017-03-30 244 17 2017-04-01 2017-04-30 249 18 2017-05-01 2017-05-31 248 19 2017-06-01 2017-06-30 45 Mostly unoccupied during summer 20 2017-07-01 2017-07-31 32 Mostly unoccupied during summer 21 2017-08-01 2017-08-31 249 22 2017-09-01 2017-09-30 253 23 2017-10-01 2017-10-31 246 24 2017-11-01 2017-11-30 270 25 2017-12-01 2017-12-31 218 Short christmas break L M N 0 B S Nm HDD CDD 7000 6000 y = 6.5191 +23033 R*0.9753 5000 5000 700 600 500 400 4000 Energy Consumption (kWh) Energy Consumption (kWh) 3000 300 200 100 Degree Days (Deg 2000 1000 01 Jan-18 01-Feb-18 01-Mar-18 8T TO 0 0 81-unto 01-May-18 100 01-01-18 01-Aug-18 01-Sep-18 01-Oct-18 01-Nov. 18 01-Dec-18 01-Jan-19 200 SO 700 606 300 500 Heating Degree Days Regression 2 -Production 120 Input Input Y Range: OK SES1-55913 100 Cancel B C D 1 Month Starting G H HDD COD Production K Energy Consumption 01-Jan-18 511 100 6000 01-Feb-18 425 0 100 - Energy Consumption 4 5000 01-Mar-18 489 0 100 7000 5 5200 01-Apr-18 205 6000 100 4000 6 01-May-18 128 0 100 7 3000 01-Jun-18 4000 17 0 100 2500 8 3000 01-Jul-18 100 2400 2000 01-Aug-18 4 0 100 2400 1000 10 01-Sep-18 27 0 100 2450 0 11 01-Oct-18 99 0 100 2550 12 01-Nov-18 336 0 100 4500 13 01-Dec-18 0 100 6200 14 15 SUMMARY OUTPUT Energy Consumption 16 7000 17 Regression Statistics 6000 18 Multiple R 0.992229018 5000 19 R Square 0.984518423 84000 20 Adjusted R Square 0978712832 3000 21 Standard Error 2000 216.115667 22 Observations 12 0 23 24 ANOVA 25 SS MS F ignificance F 26 Regression 3 23761352 15 7920450.716 169.5810784 1.4E-07 27 Residual 8 373647 8523 46705.98153 28 Total 24135000 29 30 Coefficients Standard Error t Stat P-value Lower 95% Upper 95%ower 95.09 pper 95.096 31 Intercept 2303.341882 92.90217615 24.79319621 7:48754E-09 2089.11 2517.57 2089.11 2517 57 32 HDD 6.519106927 0.290148987 22.46813609 1.62966E-08 5.85002 7.18819 5.85002 718819 33 CDD 0 65535 NUMI 0 0 0 0 34 Production 0 65535 NUM 0 0 0 0 35 36 Consumption = 6.519 x HDD +2303 37 Input X Range 5851:50513 80 Energy Consumption (kWh) Degree Days (Deg C) Labels Confidence Leve Constant is Zero os 40 1000 01-Jan-18 01-Feb-18 01-Mar-18 - 01-Apr-18 01-May-18 - 01-Jun-18 01-01-18 01-Aug-18 01-Sep-18 - 01-04-18 - 01-Nov-18 - 01 Dec 18 - Output options O Qutput Range New Worksheet New Workbook Residuals Residuals Standardized Residuals Residual Plots ne Fit Plots Normal Probability Normal Probability Plots F G 1 L M N P R S T -Nm & in 7000 -Energy Consumption - HDD CDD 6000 y=31227 +38425 R=06552 700 600 5000 7000 6000 5000 4000 3000 500 4000 . 400 Energy Consumption (kWh) LILLE 3000 300 200 100 2000 1000 2000 1000 4000 0 - 01-Jan-18 01-Feb-10 01-Mar-18 8T-ur-to 100 01-Oct-18 01-Dec-18 01-Jan-19 500 700 200 300 100 500 Heating Degree Days Energy Consumption Production Regression ? B 1 Month Starting HDD CDD Production Energy Consumption 01-Jan-18 511 0 100 6000 01-Feb-18 425 0 100 5000 01-Mar-18 489 0 100 5200 5 01-Apr-18 205 34 100 3600 6 01-May-18 128 120 100 3800 7 01-Jun-18 17 200 100 4200 8 01-Jul-18 0 280 100 4400 9 01-Aug-18 4 290 100 4500 10 01-Sep-18 27 180 100 01-Oct-18 99 20 100 3600 12 01-Nov-18 336 0 100 4500 13 01-Dec-18 606 0 100 6200 14 15 SUMMARY OUTPUT 16 17 Regression Statistics 18 Multiple R 0.982051164 19 R Square 0.964424489 20 Adjusted R Square 0.951083673 21 Standard Error 191.5165225 22 Observations 12 23 24 ANOVA 25 df SS MS F 26 Regression 3 7962931.533 2654310.511 72.291264 27 Residual 8 293735.1336 36716.8917 28 Total 11 8256666.667 29 30 Coefficients Standard Error Stat P-value 31 Intercept 2535.096251 188.4080855 13.45534744 8.92137E-07 32 HDD 5.962745643 0.449083772 13.27757985 9.88225E-07 33 CDD 6.764153155 0.876697267 7.715494744 5.66181E-05 34 Production 0 0 65535 INOM 35 7000 6000 5000 4000 120 100 Input Input Y Range SESSE513 80 Cancel Input X Range 60 3000 555533 Production Energy Consumption (kWh) Constant is zero Help 2000 1000 0 Labels Confidence Level 95 OlJan-18 01-Feb-18 01-Mar-18 01-Apr-18 01-May-18 01-Jun-18 01-Jul-18 - 01-Aue-18 01-Sep-18 - 01-Oct-18 - 01-Nov-18 - 01-Dec-18 Significance F 3.88538E-06 Output options Qutput Range New Worksheet Ely New Workbook Residuals Residuals Standardized Residuals Residual Plats Line Fit Plats Normal Probability E Normal Probability Plots Lower 95% Upper 95% ower 95.0%pper 95.0% 2100.626426 2969.5661 2100.6264 2969.5661 4.927156608 6.9983347 4.9271566 6.9983347 4.742485632 8.7858207 4.7424856 8.7858207 0 0 0 0 JAU M N P Q U Energy Consumption - HDD CDD 700 600 10000 9000 8000 7000 6000 5000 y=23747x - 55116 R0,0972 500 Energy Consumption (kWh) 400 300 200 100 Energy Consumption (kWh Degree Days (DegC) 4000 4000 3000 2000 1000 0 0 0 - 01-Jan-18 01-Feb-18 01-Mar-18 01-Apr-18 01-May-18 01-Jun-18 01-Jul-18 01-Aug-18 01-Sep-18 100 01-Nov-18 01-Dec-18 01-Jan-19 200 600 700 300 400 500 Heating Degree Days Energy Consumption - Production Regression ? x Input B 1 Month Starting G H HDD CDD Production Energy Consumption 2. 01-Jan-18 511 0 100 6000 3 01-Feb-18 425 0 200 7000 4 01-Mar-18 489 0 10000 300 9200 5 9000 01-Apr-18 205 34 100 3600 8000 6 01-May-18 128 120 7000 200 6000 7 6000 01-Jun-18 17 200 200 6000 5000 8 01-Jul-18 0 4000 280 300 8200 3000 9 01-Aug-18 4. 290 200 2000 6500 1000 10 01-Sep-18 27 180 100 0 11 01-Oct-18 99 20 100 3600 12 01-Nov-18 336 0 200 6600 13 01-Dec-18 606 0 100 6200 14 15 SUMMARY OUTPUT 16 10000 17 Regression Statistics 9000 18 Multiple R 0.993486035 8000 7000 19 R Square 0.987014501 20 Adjusted R Square 5000 0.982144939 4000 21 Standard Error 228.556835 3000 2000 22 Observations 12 1000 23 0 24 ANOVA 25 df SS MS F Significance F 26 Regression 3 31764594.19 10588198.06 202.69061 6.96093E-08 27 Residual 8 417905.8147 52238.22684 28 Total 11 32182500 29 30 Coefficients Standard Error t Stat P-value Lower 95% Upper 95% ower 95.09|pper 95.0% 31 Intercept 768.1797704 244.5528598 3.141160447 0.01378107 204.2398644 1332.12 204.2399 1332.12 32 HDD 6.099050456 0.557210669 10.94568139 4.30686E-06 4.814120348 7.383981 4.81412 7.383981 33 CDD 6.922426798 1.1476988 6.031571 0.000312233 4.275828619 9.569025 4.275829 9.569025 34 Production 18.35097066 1.012357171 18.12697256 8.81047E-08 16.01647084 20.68547 16.01647 20.68547 35 36 Consumption = 6.099 x HDD +6.922 x CDD +18.35 x Production + 768 OK Input Y Range SES1:SE$131 350 300 250 200 150 Cancel 6000 Production Input X Range: $B$1:50513 Help Labels Confidence Level: Constant is Zero 95 100 50 BT-uerto 01-Feb-18 01-Mar-18 01-Nov-18 01-Dec-18 Output options O Output Range New Worksheet Ply: New Workbook Residuals Residuals Standardized Residuals Residual Plots Line Fit Plots Normal Probability Normal Probability Piots o O O N O P R S 7000 6000 y = 3.1227x + 38425 R = 0.6552 5000 4000 700 600 500 400 300 200 100 Energy Consumption (kWh) Degree Days (Deg C) Energy Consumption (kWh) 3000 2000 1000 0 0 0 100 200 01-Aug-18 01-Sep-18 01-Jan-18 01-Feb-18 01-Mar-18 01-Apr-18 01-May-18 6T-ver-to 700 600 01-Nov-19 01-Dec-18 300 400 500 Heating Degree Days Regression 2 X Input Input Y Range OK 6000 SEST:SE513 Cancel A B E 1 Month Starting F G H HDD CDD M Production Energy Consumption 2 01-Jan-18 511 0 100 6000 3 01-Feb-18 425 0 200 Energy Consumption - HDD CDD 5000 01-Mar-18 489 0 300 5200 7000 5 01-Apr-18 205 34 100 6000 3600 6 01-May-18 128 120 5000 200 3800 7 01-Jun-18 17 4000 200 200 4200 8 3000 01-Jul-18 0 280 300 4400 2000 9 01-Aug-18 4 290 200 4500 1000 10 01-Sep-18 27 180 100 4000 0 11 01-Oct-18 99 20 100 3600 12 01-NOV-18 336 0 200 4500 13 01-Dec-18 606 0 100 6200 14 15 SUMMARY OUTPUT Energy Consumption - Production 16 17 Regression Statistics 7000 18 Multiple R 0.966788028 5000 19 R Square 0.934679091 4000 20 Adjusted R Square 0.91018375 3000 21 Standard Error 259.6471101 2000 22 Observations 12 1000 0 23 24 ANOVA 25 df SS MS F Significance F 26 Regression 3 7717333.692 2572444.564 38.15742315 4.36162E-05 27 Residual 8 539332.9742 67416.62177 28 Total 11 8256666.667 29 30 Coefficients Standard Error t Stat P-value Lower 95% Upper 95%ower 95.09 pper 95.0% 31 Intercept 2682.309531 277.8190523 9.654879711 1.10261E-05 2041.657648 3322.961 2041.658 3322.961 32 HDD 6.196988916 0.633007278 9.789759344 9.94517E-06 4.737271515 7.656706 4.737272 7.656706 33 CDD 7.486062791 1.303818705 5.74164396 0.000433128 4.479451466 10.49267 4.479451 10.49267 34 Production -1.545179237 1.150066738 -1.343556148 0215953630 -4.197237892 1.106879 -4.197238 1.106879 35 36 Consumption = 6.197 x HDD +7.486 x CDD - 1.545 x Production +2682 37 38 Input X Range: S8$1:$D$13 Production HIMNI 350 300 250 200 150 100 50 Labels Energy Consumption (kWh) Help Constant is Zero 95 Confidence Level: 01-Jan-18 01-Feb-18 01-Mar-18 01-Apr-18 01-May-18 -- 01-Oct-18 01-Nov-18 01-Dec-18 Output options Qutput Range New Worksheet Ply: New Workbook Residuals Besiduals Standardized Residuals Resigual Plots Line Fit Plots Normal Probability Normal Probability Plots M N 0 R S U HDD CDD y = 3-1537x +42101 R = 0.0515 200 En III 700 600 500 400 300 200 100 Degree Days (Deg C) Energy Consumption (kWh) 10000 9000 8000 7000 6000 5000 4000 3000 2000 1000 0 2000 336 01-Jan-18 01-Mar-18 01-Apr-18 01-Nov-18 01-Dec-18 01-Jan-19 100 600 700 200 300 400 500 Heating Degree Days -Production Regression D 1 Month Starting F H HDD 1 CDD Production 2 01-Jan-18 Energy Consumption 511 100 3 01-Feb-18 7000 425 0 200 Energy Consumption 4 01-Mar-18 2000 489 0 300 5 5000 10000 01-Apr-18 205 34 100 6 1000 8000 01-May-18 128 120 200 7 2000 01-Jun-18 6000 17 200 8000 8 01-Jul-18 0 280 4000 300 7000 9 01-Aug-18 4 290 200 7500 10 01-Sep-18 27 180 100 1000 11 01-Oct-18 99 20 100 2000 12 01-Nov-18 0 200 8000 13 01-Dec-18 606 0 100 9000 14 15 SUMMARY OUTPUT 16 Energy Consumption 17 Regression Statistics 10000 18 Multiple R 0.6 6760993 8000 19 R Square 0E1B35001 6000 20 Adjusted R Square 01218085627 4000 21 Standard Error 2760.830353 2000 22 Observations 12. 23 0 24 ANOVA 25 df SS MS gnificance F 26 Regression 3 46251692.74 15417230.91 2.022678858 0.18935 27 Residual 8 60977473.92 7622184.24 28 Total 11 107229166.7 29 30 Coefficients Standard Error t Stat P-value Lower 95%Jpper 95%ower 95.0%pper 95.0% 31 Intercept -1632.09357 2954.052799 -0.552493026 3570536 -8444.15 5179.96 -8444.15 5179.96 32 HDD 15.02984491 6.730772804 2.233004343 0.056033725 -0.49135 30.551 -0.49135 30.551 33 CDD 28.04432107 13.8635175 2.022886404 0.079709981 -3.92501 60.0136 3.92501 60.0136 34 Production 2.27301786 12.22867129 0.185876111 3.857116845 -25.9263 30.4724 -25.9263 30.4724 35 36 Input Input Y Range: OK SE51:SES13 Cancel Input X Range 350 300 250 200 150 100 so Production n $B$1:$D$13 Constant is Zero Help Labels Confidence Level: 0 01-Jan-18 01-Apr-18 01-Jun-18 -- 01-Jul-18 01-Nov-18 01-Dec-18 Output options Qutput Range: New Worksheet Ply: New Workbook Residuals Residuals Standardized Residuals Residual Plats Une Fit Plots Normal Probability Normal Probability Plots
Step by Step Solution
There are 3 Steps involved in it

Get step-by-step solutions from verified subject matter experts