Elizabeth Burke has asked you to do some preliminary analysis of the data in the Performance Lawn Equipment database.


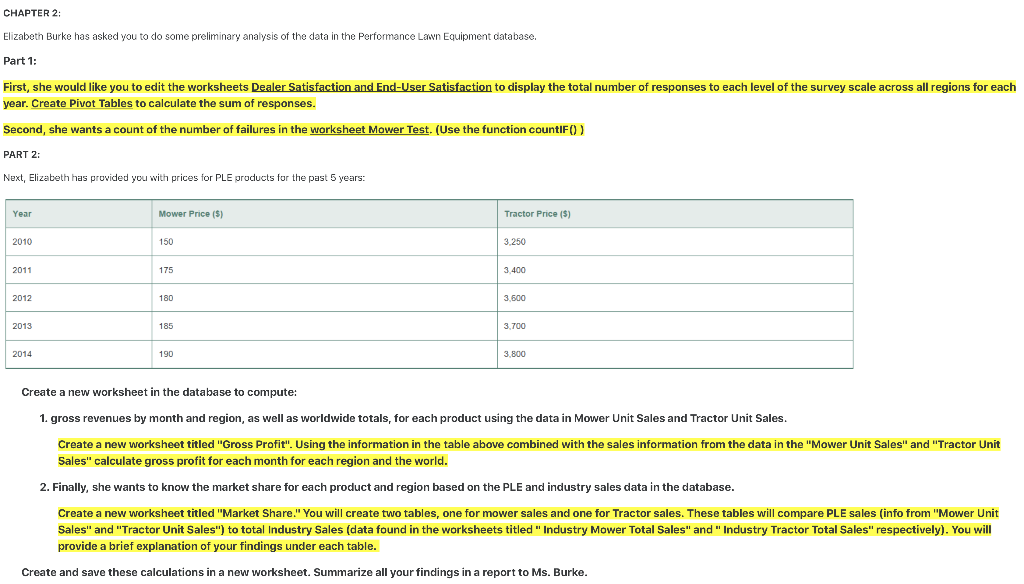
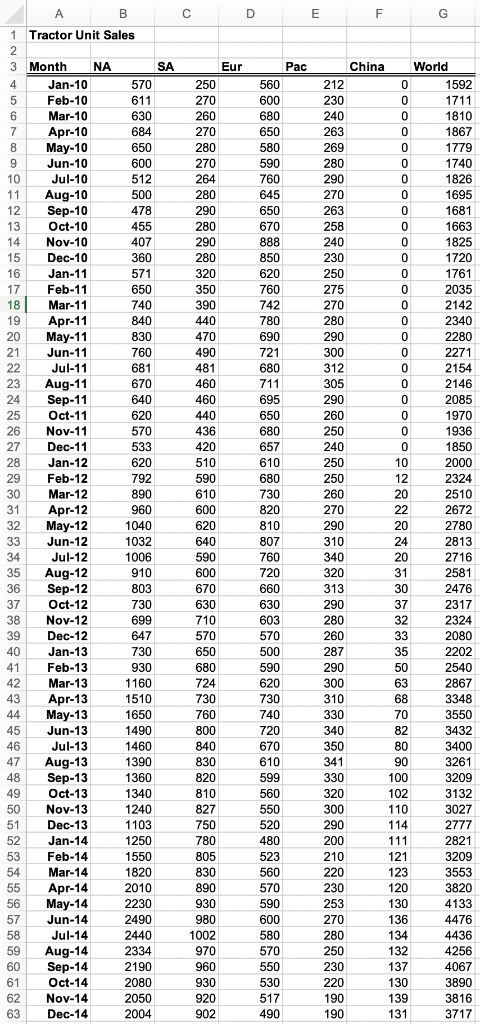
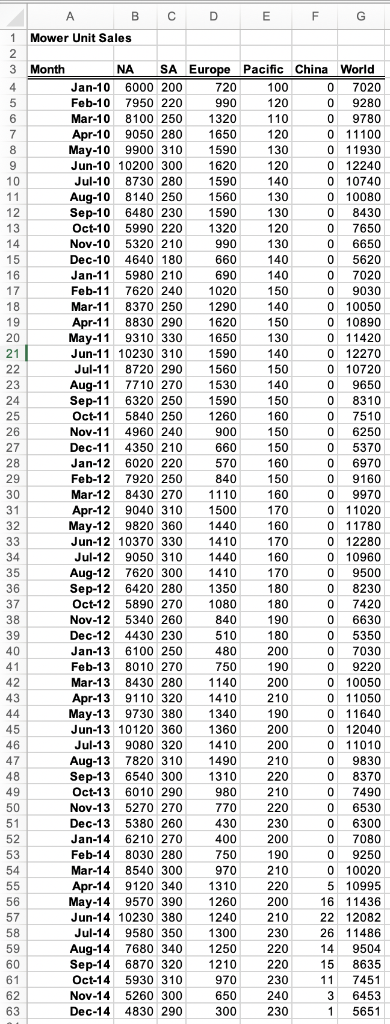
CHAPTER 2: Elizabeth Burke has asked you to do some preliminary analysis of the data in the Performance Lawn Equipment database. Part1: First, she would like you to edit the worksheets Dealer Satisfaction and End-User Satisfaction to display the total number of responses to each level of the survey scale across all regions for each year. Create Pivot Tables to calculate the sum of responses. Second, she wants a count of the number of failures in the worksheet Mower Test. (Use the function countIFO) PART 2: Next, Elizabeth has provided you with prices for PLE products for the past 5 years: Mower Price (S) Tractor Price ($) Year 2010 150 3,250 2011 175 3,400 2012 180 3,600 2013 185 3,700 2014 3,800 Create a new worksheet in the database to compute: 1. gross revenues by month and region, as well as worldwide totals, for each product using the data in Mower Unit Sales and Tractor Unit Sales Create a new worksheet titled "Gross Profit". Using the information in the table above combined with the sales information from the data in the "Mower Unit Sales and "Tractor Unit Sales" calculate gross profit for each month for each region and the world. 2. Finally, she wants to know the market share for each product and region based on the PLE and industry sales data in the database Create a new worksheet titled "Market Share." You will create two tables, one for mower sales and one for Tractor sales. These tables will compare PLE sales (info from "Mower Unit Sales" and "Tractor Unit Sales") to total industry Sales (data found in the worksheets titled " Industry Mower Total Sales" and " Industry Tractor Total Sales" respectively). You will provide a brief explanation of your findings under each table. Create and save these calculations in a new worksheet. Summarize all your findings in a report to Ms. Burke 1 Tractor Unit Sales China 3 Month NA SA World 1592 Feb-10 230 680 1810 1867 1779 263 269 280 Apr-10 1826 1695 1681 1663 1825 1720 1761 2035 270 263 258 12 Sep-10 478 13 Oct-10 15 Dec-10 17 Feb-11 Apr-11 670 230 571 275 270 280 780 2340 2280 2271 2154 680 695 680 2085 1970 1936 1850 25 Oct-11 27 Dec-11 29 Feb-12 Apr-12 33 Jun-12 260 657 2324 2510 2672 2780 2813 2716 2581 2476 2317 2324 2080 2202 2540 2867 3348 680 1040 807 1006 320 LUI 36 Sep-12 Oct-12 39 Dec-12 Feb-13 280 260 287 570 1510 330 45 Jun-13 1490 1460 1390 1360 1340 1240 3432 670 3261 3209 3132 3027 LI 599 Oct-13 51 Dec-13 53 Feb-14 320 2821 3209 805 1550 1820 2010 2230 2490 2440 2334 230 253 270 280 3820 4133 4476 4436 57 Jun-14 1002 LUI 60 Sep-14 Oct-14 4067 3890 3816 3717 230 2080 2050 2004 63 Dec-14 1 2 Mower Unit Sales NA SA Europe Pacific China World an-10 6000 200 Feb-10 7950 220 Mar-10 8100 2501320 Apr-10 9050 280 1650 120 May-10 00310 1590 130 Jun-10 10200 300 1620 Jul-10 8730 280 1590 140 Aug-10 8140 250 1560 130 Sep-10 6480 230 1590130 Oct-10 5990 220 1320 Nov-10 5320 210 Dec-10 an-11 5980 210 Feb-11 7620 240 1020 9030 Mar-11 8370 250 1290 Apr11 8830 290 1620150 May-11 9310 330 1650 130 Jun-11 10230 310 1590 140 Jul-118720 2901560 Aug-11 7710 270 1530 Sep-11 6320 250 1590 150 Oct-115840 250 1260 160 Nov-11 4960 240 900 150 Dec-11 4350 210 Ja12 6020 220 570 160 Feb-12 7920 250840 150 Mar-12 8430 270 1110 Apr-12 9040 310 1500170 May-12 9820 360 1440 160 Jun-12 10370 330 1410 170 Ju12 9050 310 1440 160 0 10960 Aug-12 7620 300 1410 Sep-12 6420 280 1350180 Oct-12 5890 270 1080 180 Nov-12 5340 260 840 190 Dec-124430 230510180 Jan-13 6100 250 Feb-13 8010 270 Mar-13 8430 280 1140 200 Apr13 9110 320 1410210 May-13 9730 380 340190 Jun-13 10120 360 1360 200 Jul-13 9080 320 1410 Aug-13 7820 310 1490 Sep-13 6540 300 1310 Oct-13 6010 290 Nov-13 5270 270 Dec-13 5380 260 Jan-14 6210 270 Feb-14 8030 280 750 190 Mar-14 8540 300 Apr-14 9120 3401310220 May-14 9570 390 1260 20016 11436 Jun-14 10230 380 140 210 22 12082 Jul-14 9580 350 1300 230 26 11486 Aug-14 7680 340 1250 22014 9504 Sep-14 6870 320 1210 Oct-14 5930 310 Nov-14 5260 300 650 240 Dec-14 4830 290300 230 4 0 7020 0 9280 9780 0 11930 0 12240 0 10740 0 10080 8430 7650 0 6650 0 5620 4640 180660 0 10050 0 10890 0 11420 0 12270 0 10720 0 9650 21 0 6250 0 9970 0 11780 0 12280 0 9500 0 8230 0 6630 480200 0 9220 0 10050 0 11050 0 8370 0 6530 7080 0 9250 0 10020 5 10995 400 200 54 970210 970 230 6453 CHAPTER 2: Elizabeth Burke has asked you to do some preliminary analysis of the data in the Performance Lawn Equipment database. Part1: First, she would like you to edit the worksheets Dealer Satisfaction and End-User Satisfaction to display the total number of responses to each level of the survey scale across all regions for each year. Create Pivot Tables to calculate the sum of responses. Second, she wants a count of the number of failures in the worksheet Mower Test. (Use the function countIFO) PART 2: Next, Elizabeth has provided you with prices for PLE products for the past 5 years: Mower Price (S) Tractor Price ($) Year 2010 150 3,250 2011 175 3,400 2012 180 3,600 2013 185 3,700 2014 3,800 Create a new worksheet in the database to compute: 1. gross revenues by month and region, as well as worldwide totals, for each product using the data in Mower Unit Sales and Tractor Unit Sales Create a new worksheet titled "Gross Profit". Using the information in the table above combined with the sales information from the data in the "Mower Unit Sales and "Tractor Unit Sales" calculate gross profit for each month for each region and the world. 2. Finally, she wants to know the market share for each product and region based on the PLE and industry sales data in the database Create a new worksheet titled "Market Share." You will create two tables, one for mower sales and one for Tractor sales. These tables will compare PLE sales (info from "Mower Unit Sales" and "Tractor Unit Sales") to total industry Sales (data found in the worksheets titled " Industry Mower Total Sales" and " Industry Tractor Total Sales" respectively). You will provide a brief explanation of your findings under each table. Create and save these calculations in a new worksheet. Summarize all your findings in a report to Ms. Burke 1 Tractor Unit Sales China 3 Month NA SA World 1592 Feb-10 230 680 1810 1867 1779 263 269 280 Apr-10 1826 1695 1681 1663 1825 1720 1761 2035 270 263 258 12 Sep-10 478 13 Oct-10 15 Dec-10 17 Feb-11 Apr-11 670 230 571 275 270 280 780 2340 2280 2271 2154 680 695 680 2085 1970 1936 1850 25 Oct-11 27 Dec-11 29 Feb-12 Apr-12 33 Jun-12 260 657 2324 2510 2672 2780 2813 2716 2581 2476 2317 2324 2080 2202 2540 2867 3348 680 1040 807 1006 320 LUI 36 Sep-12 Oct-12 39 Dec-12 Feb-13 280 260 287 570 1510 330 45 Jun-13 1490 1460 1390 1360 1340 1240 3432 670 3261 3209 3132 3027 LI 599 Oct-13 51 Dec-13 53 Feb-14 320 2821 3209 805 1550 1820 2010 2230 2490 2440 2334 230 253 270 280 3820 4133 4476 4436 57 Jun-14 1002 LUI 60 Sep-14 Oct-14 4067 3890 3816 3717 230 2080 2050 2004 63 Dec-14 1 2 Mower Unit Sales NA SA Europe Pacific China World an-10 6000 200 Feb-10 7950 220 Mar-10 8100 2501320 Apr-10 9050 280 1650 120 May-10 00310 1590 130 Jun-10 10200 300 1620 Jul-10 8730 280 1590 140 Aug-10 8140 250 1560 130 Sep-10 6480 230 1590130 Oct-10 5990 220 1320 Nov-10 5320 210 Dec-10 an-11 5980 210 Feb-11 7620 240 1020 9030 Mar-11 8370 250 1290 Apr11 8830 290 1620150 May-11 9310 330 1650 130 Jun-11 10230 310 1590 140 Jul-118720 2901560 Aug-11 7710 270 1530 Sep-11 6320 250 1590 150 Oct-115840 250 1260 160 Nov-11 4960 240 900 150 Dec-11 4350 210 Ja12 6020 220 570 160 Feb-12 7920 250840 150 Mar-12 8430 270 1110 Apr-12 9040 310 1500170 May-12 9820 360 1440 160 Jun-12 10370 330 1410 170 Ju12 9050 310 1440 160 0 10960 Aug-12 7620 300 1410 Sep-12 6420 280 1350180 Oct-12 5890 270 1080 180 Nov-12 5340 260 840 190 Dec-124430 230510180 Jan-13 6100 250 Feb-13 8010 270 Mar-13 8430 280 1140 200 Apr13 9110 320 1410210 May-13 9730 380 340190 Jun-13 10120 360 1360 200 Jul-13 9080 320 1410 Aug-13 7820 310 1490 Sep-13 6540 300 1310 Oct-13 6010 290 Nov-13 5270 270 Dec-13 5380 260 Jan-14 6210 270 Feb-14 8030 280 750 190 Mar-14 8540 300 Apr-14 9120 3401310220 May-14 9570 390 1260 20016 11436 Jun-14 10230 380 140 210 22 12082 Jul-14 9580 350 1300 230 26 11486 Aug-14 7680 340 1250 22014 9504 Sep-14 6870 320 1210 Oct-14 5930 310 Nov-14 5260 300 650 240 Dec-14 4830 290300 230 4 0 7020 0 9280 9780 0 11930 0 12240 0 10740 0 10080 8430 7650 0 6650 0 5620 4640 180660 0 10050 0 10890 0 11420 0 12270 0 10720 0 9650 21 0 6250 0 9970 0 11780 0 12280 0 9500 0 8230 0 6630 480200 0 9220 0 10050 0 11050 0 8370 0 6530 7080 0 9250 0 10020 5 10995 400 200 54 970210 970 230 6453


