Answered step by step
Verified Expert Solution
Link Copied!

Question

1 Approved Answer

Ellis is filling a container with water at a constant rate. The graph shows how the volume of water in the container varies with the

image text in transcribed

image text in transcribed
Ellis is filling a container with water at a constant rate. The graph shows how the volume of water in the container varies with the amount of time since the container began filling. We see that there are 4 liters of water in the container when the container has been filling for 6 minutes. 5 -4 Volume No 40 Time a. Define a formula to determines the volume (in liters) of water in the container, v, in terms of the number of number of minutes, t, since the container began to fill. Preview b. Define a formula to determine the number of minutes the container has been filling, t, in terms of the number of liters that have been added to the tank, v. Preview

Step by Step Solution

There are 3 Steps involved in it

Step: 1

blur-text-image

Get Instant Access to Expert-Tailored Solutions

See step-by-step solutions with expert insights and AI powered tools for academic success

Step: 2

blur-text-image_2

Step: 3

blur-text-image_3

Ace Your Homework with AI

Get the answers you need in no time with our AI-driven, step-by-step assistance

Get Started

Recommended Textbook for

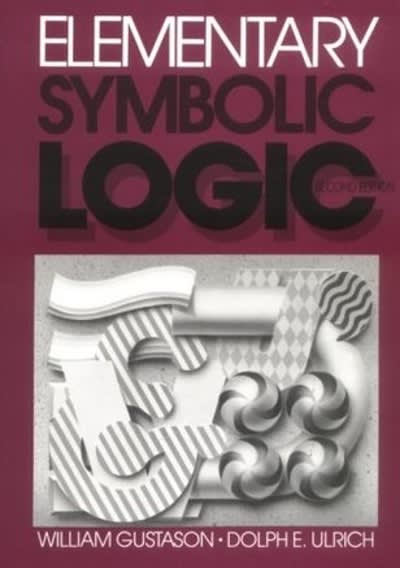
Elementary Symbolic Logic

Authors: William Gustason, Dolph E Ulrich

2nd Edition

1478616857, 9781478616856

More Books

Students also viewed these Mathematics questions

Question

Prove Equation (5.22).

Answered: 1 week ago

Question

Context, i.e. the context of the information presented and received

Answered: 1 week ago