Answered step by step
Verified Expert Solution
Question
1 Approved Answer
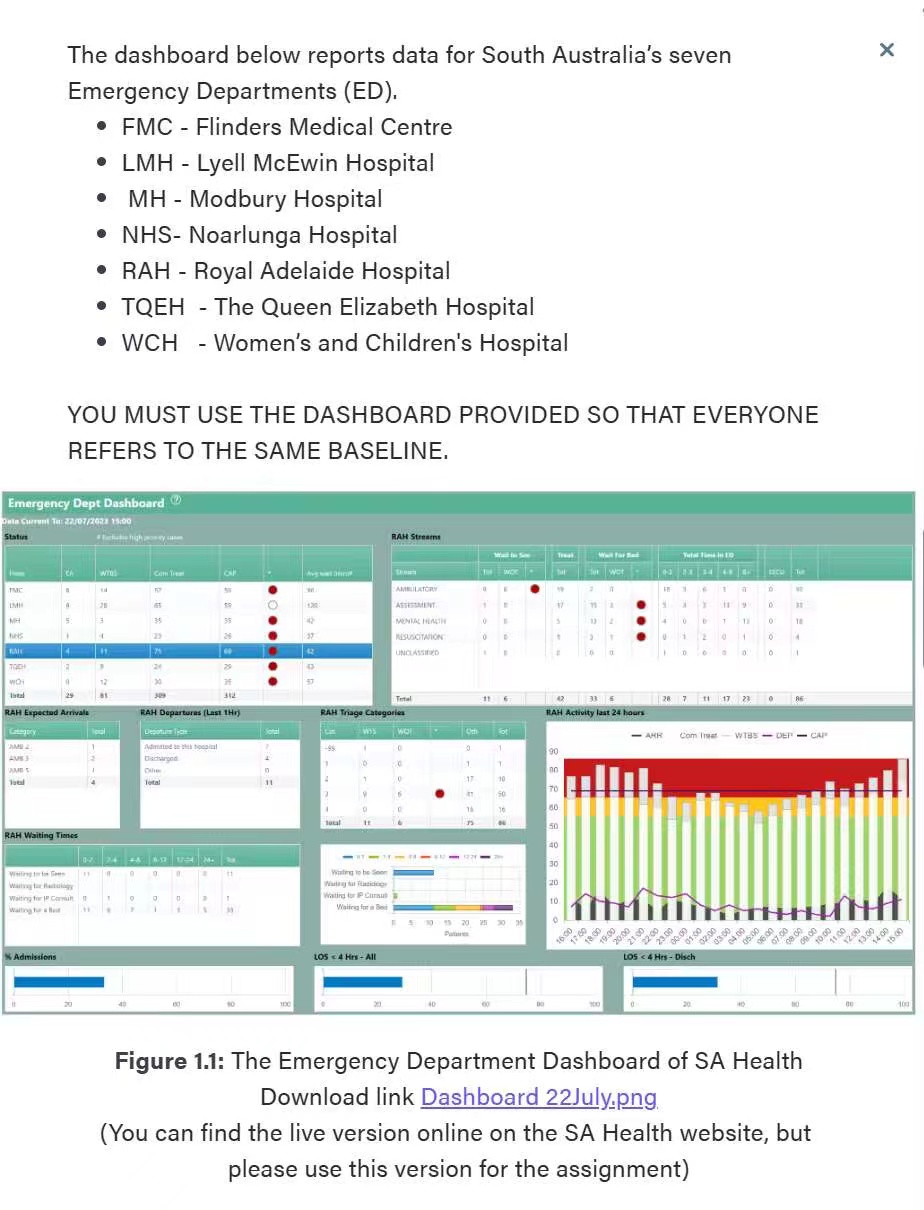
Emergency Dept Dashboard Data Current To: 22/07/2023 15:00 Status # Excludes high priority cases RAH Streams Wait to See Treat Wait For Bed Total Time
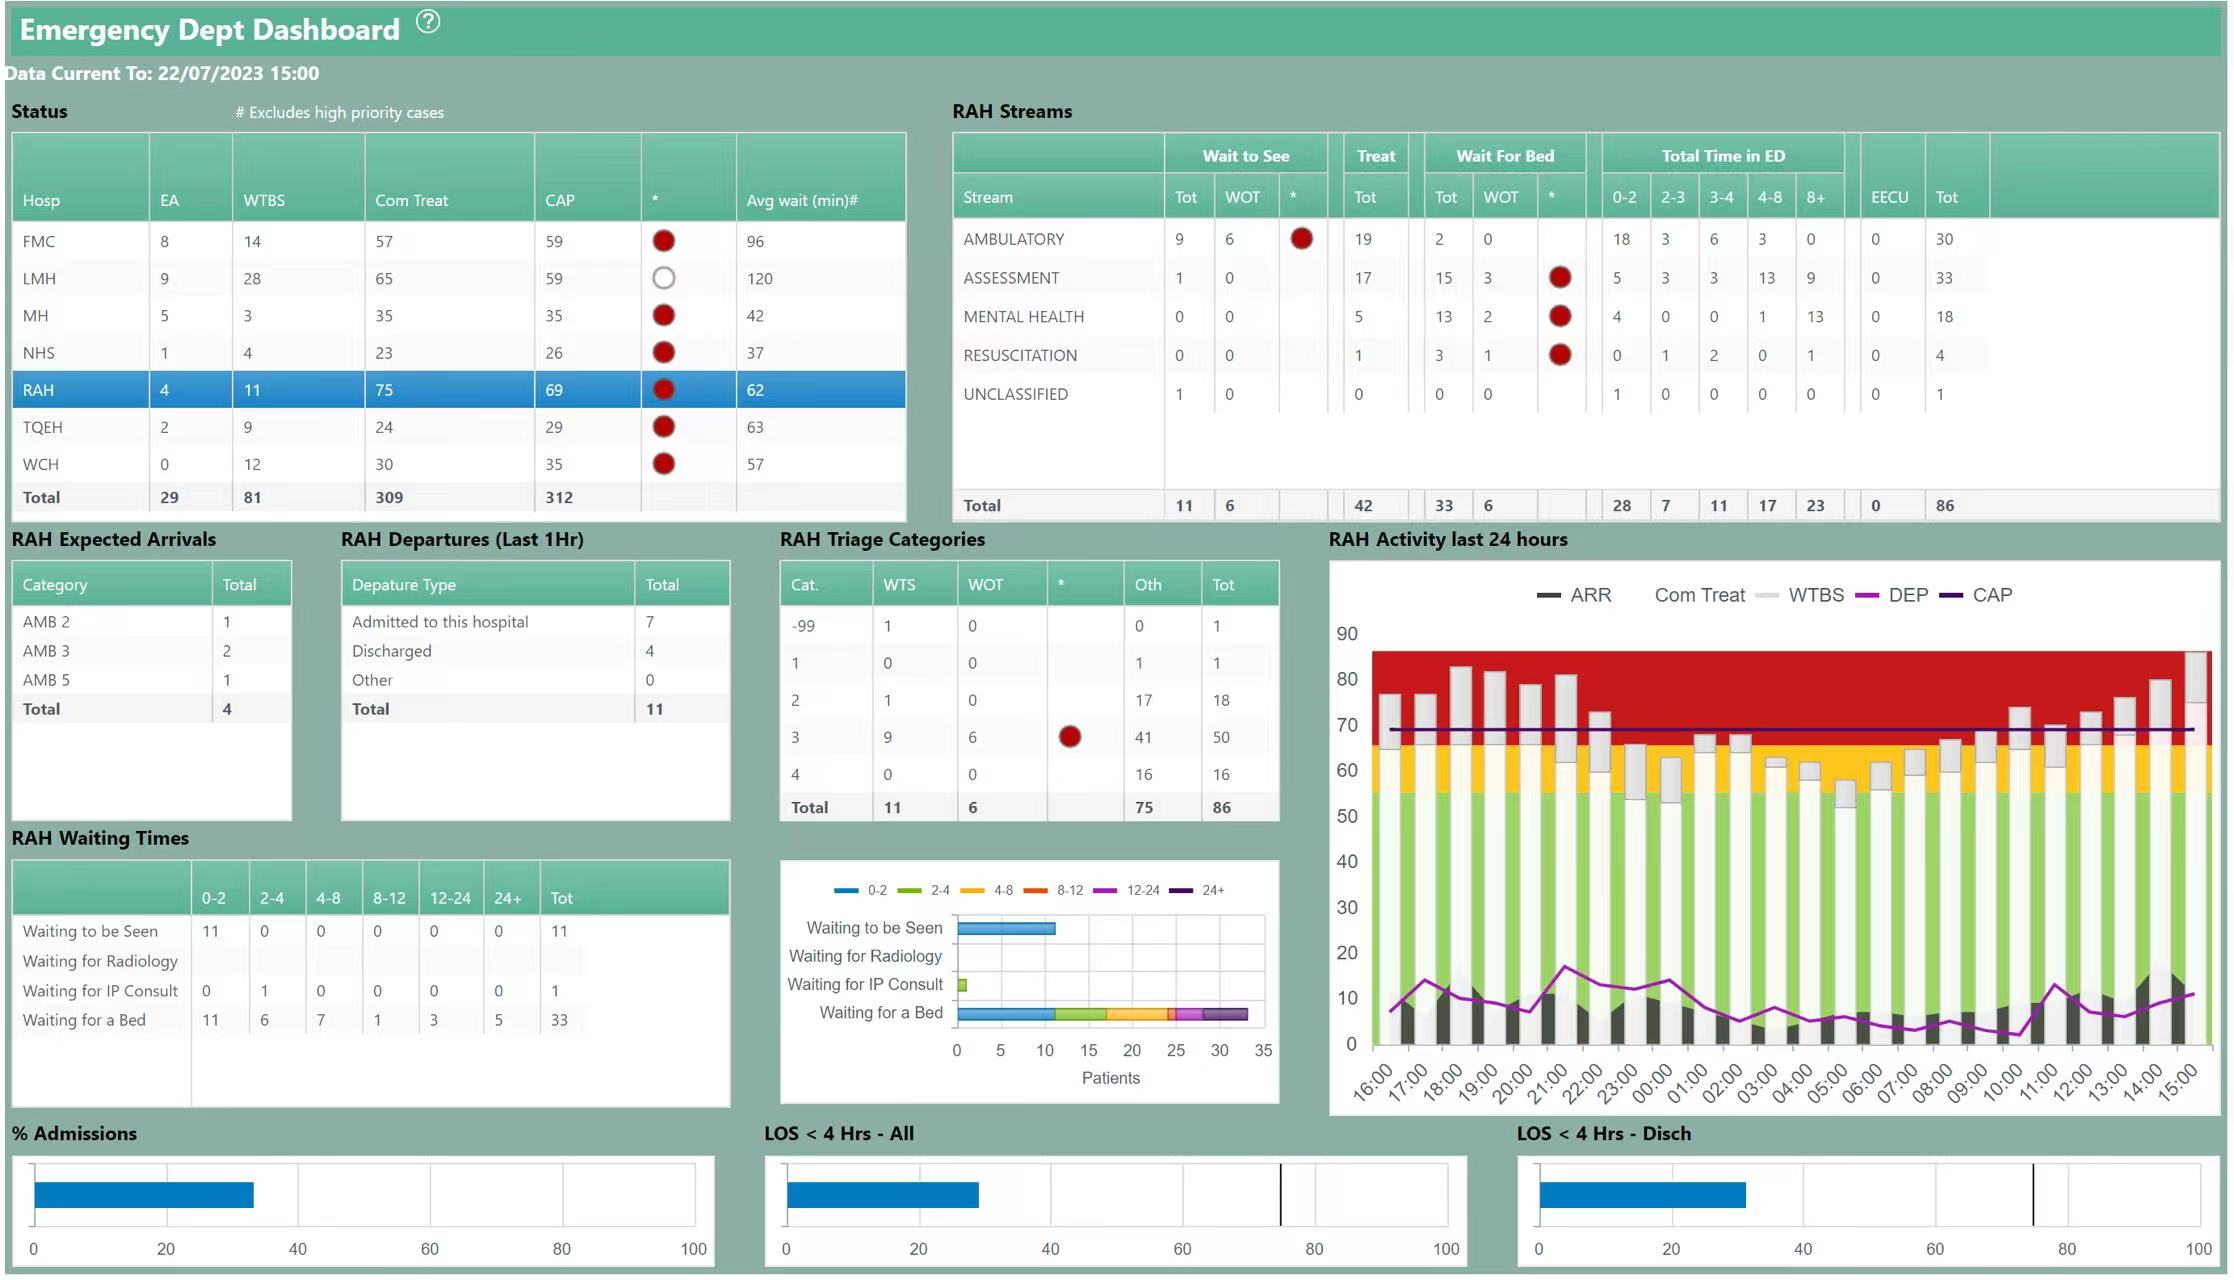
Emergency Dept Dashboard Data Current To: 22/07/2023 15:00 Status # Excludes high priority cases RAH Streams Wait to See Treat Wait For Bed Total Time in ED Stream Tot WOT Tot Tot WOT 0-2 2-3 3-4 4-8 8+ EECU Tot Hosp EA WTBS Com Treat CAP Avg wait (min)# 6 2 18 3 3 19 0 30 8 14 57 50 96 AMBULATORY FMC 3 O ASSESSMENT 17 15 5 3 9 32 LMH 28 65 50 120 42 MENTAL HEALTH 0 5 13 1 13 18 O MH 3 35 35 37 0 1 3 0 1 4 NHS 1 23 26 RESUSCITATION 69 62 UNCLASSIFIED 1 0 0 0 0 0 0 0 RAH 4 11 75 TOEH 9 24 29 63 N 12 30 57 WCH 0 35 Total 29 81 309 312 11 6 42 33 6 7 23 0 86 Total 28 RAH Expected Arrivals RAH Departures (Last 1Hr) RAH Triage Categories RAH Activity last 24 hours Depature Type Total Cat. Oth Tot Category Total WTS WOT ARR Com Treat - WTBS - DEP - CAP AMB 2 Admitted to this hospital 99 1 0 0 1 90 AMB 3 OfV N Discharged 0 0 80 AMB 5 Other 0 11 2 1 17 18 Total Total 70 3 9 6 41 50 0 16 16 60 Total 11 6 75 86 50 RAH Waiting Times 40 0-2 2-4 4 8 8-12 12-24 24+ 0-2 2-4 4-8 8-12 12-24 24+ Tot 30 Waiting to be Seen 11 0 O O O 0 11 Waiting to be Seen Waiting for Radiology 20 Waiting for Radiology Waiting for IP Consult Waiting for IP Consult 0 1 0 0 10 Waiting for a Bed 11 6 3 33 Waiting for a Bed o 0 5 10 30 35 Patients 6:00 7:00 18:00 :00 3:00 19:0 22:0 23:00 0:00 1:00 02:0 04: 05:0 06:0 7:00 8:00 09:00 10:0 11:00 12:0 13:00 14:00 15:00 21: % Admissions LOS
Step by Step Solution
There are 3 Steps involved in it
Step: 1
Get Instant Access to Expert-Tailored Solutions
See step-by-step solutions with expert insights and AI powered tools for academic success
Step: 2
Step: 3
Ace Your Homework with AI
Get the answers you need in no time with our AI-driven, step-by-step assistance
Get Started