Answered step by step
Verified Expert Solution
Question
1 Approved Answer
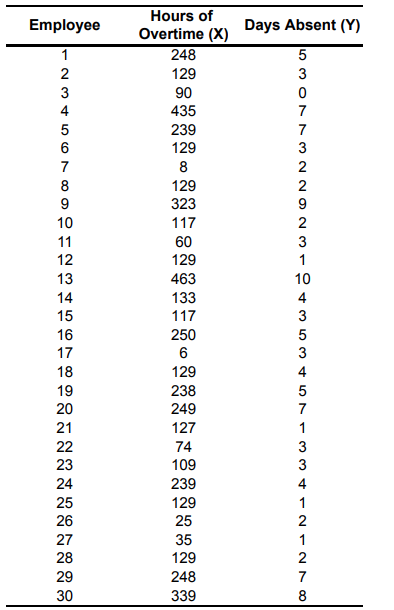
Employee 1 23456LOH23 7 8 9 10 11 12 13 14 15 16 17 18 19 2N2222ENERS 20 21 23 24 25 26 27


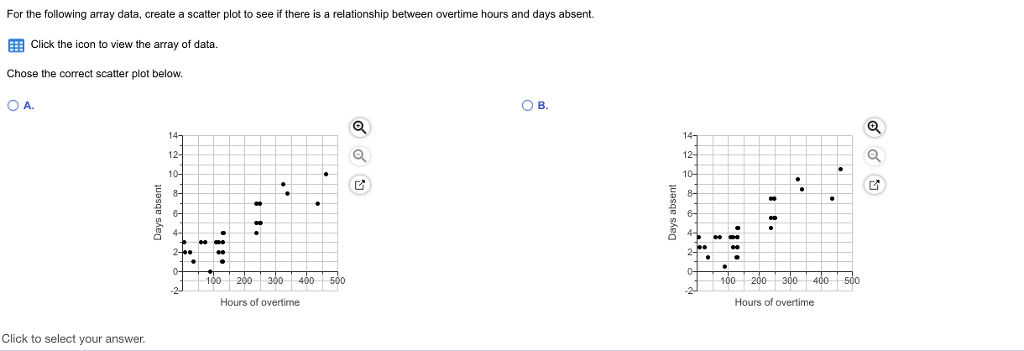
Employee 1 23456LOH23 7 8 9 10 11 12 13 14 15 16 17 18 19 2N2222ENERS 20 21 23 24 25 26 27 28 29 30 Hours of Overtime (X) 248 129 90 435 239 129 8 129 323 117 60 129 463 133 117 250 6 129 238 249 127 74 109 239 129 25 35 129 248 339 Days Absent (Y) 5 3 12777 A WW NG AWOWA W NON N WN NOW 0 7 3 2 9 2 3 10 4 3 5 3 4 5 7 1 3 3 1 O C. There 14] 12- 10- 8- of 100 200 300 400 500 Hours of overtime : 100 200 300 400 500 Hours of overtime Q a linear relationship between overtime hours and days absent. OD. # -2 147 12- 10- 8- 0+ 100 200 300 400 500 Hours of overtime . . 100 200 300 400 500 Hours of overtime Q For the following array data, create a scatter plot to see if there is a relationship between overtime hours and days absent. Click the icon to view the array of data. Chose the correct scatter plot below. OA. Click to select your answer. 14- 12 10- 300 400 500 Hours of overtime G O B. 10- 4. Days absent 100 200 300 400 500 Hours of overtime Q Q
Step by Step Solution
★★★★★
3.38 Rating (148 Votes )
There are 3 Steps involved in it
Step: 1
Here are the direct calculations to analyze the relationship between overt...
Get Instant Access to Expert-Tailored Solutions
See step-by-step solutions with expert insights and AI powered tools for academic success
Step: 2

Step: 3

Ace Your Homework with AI
Get the answers you need in no time with our AI-driven, step-by-step assistance
Get Started


