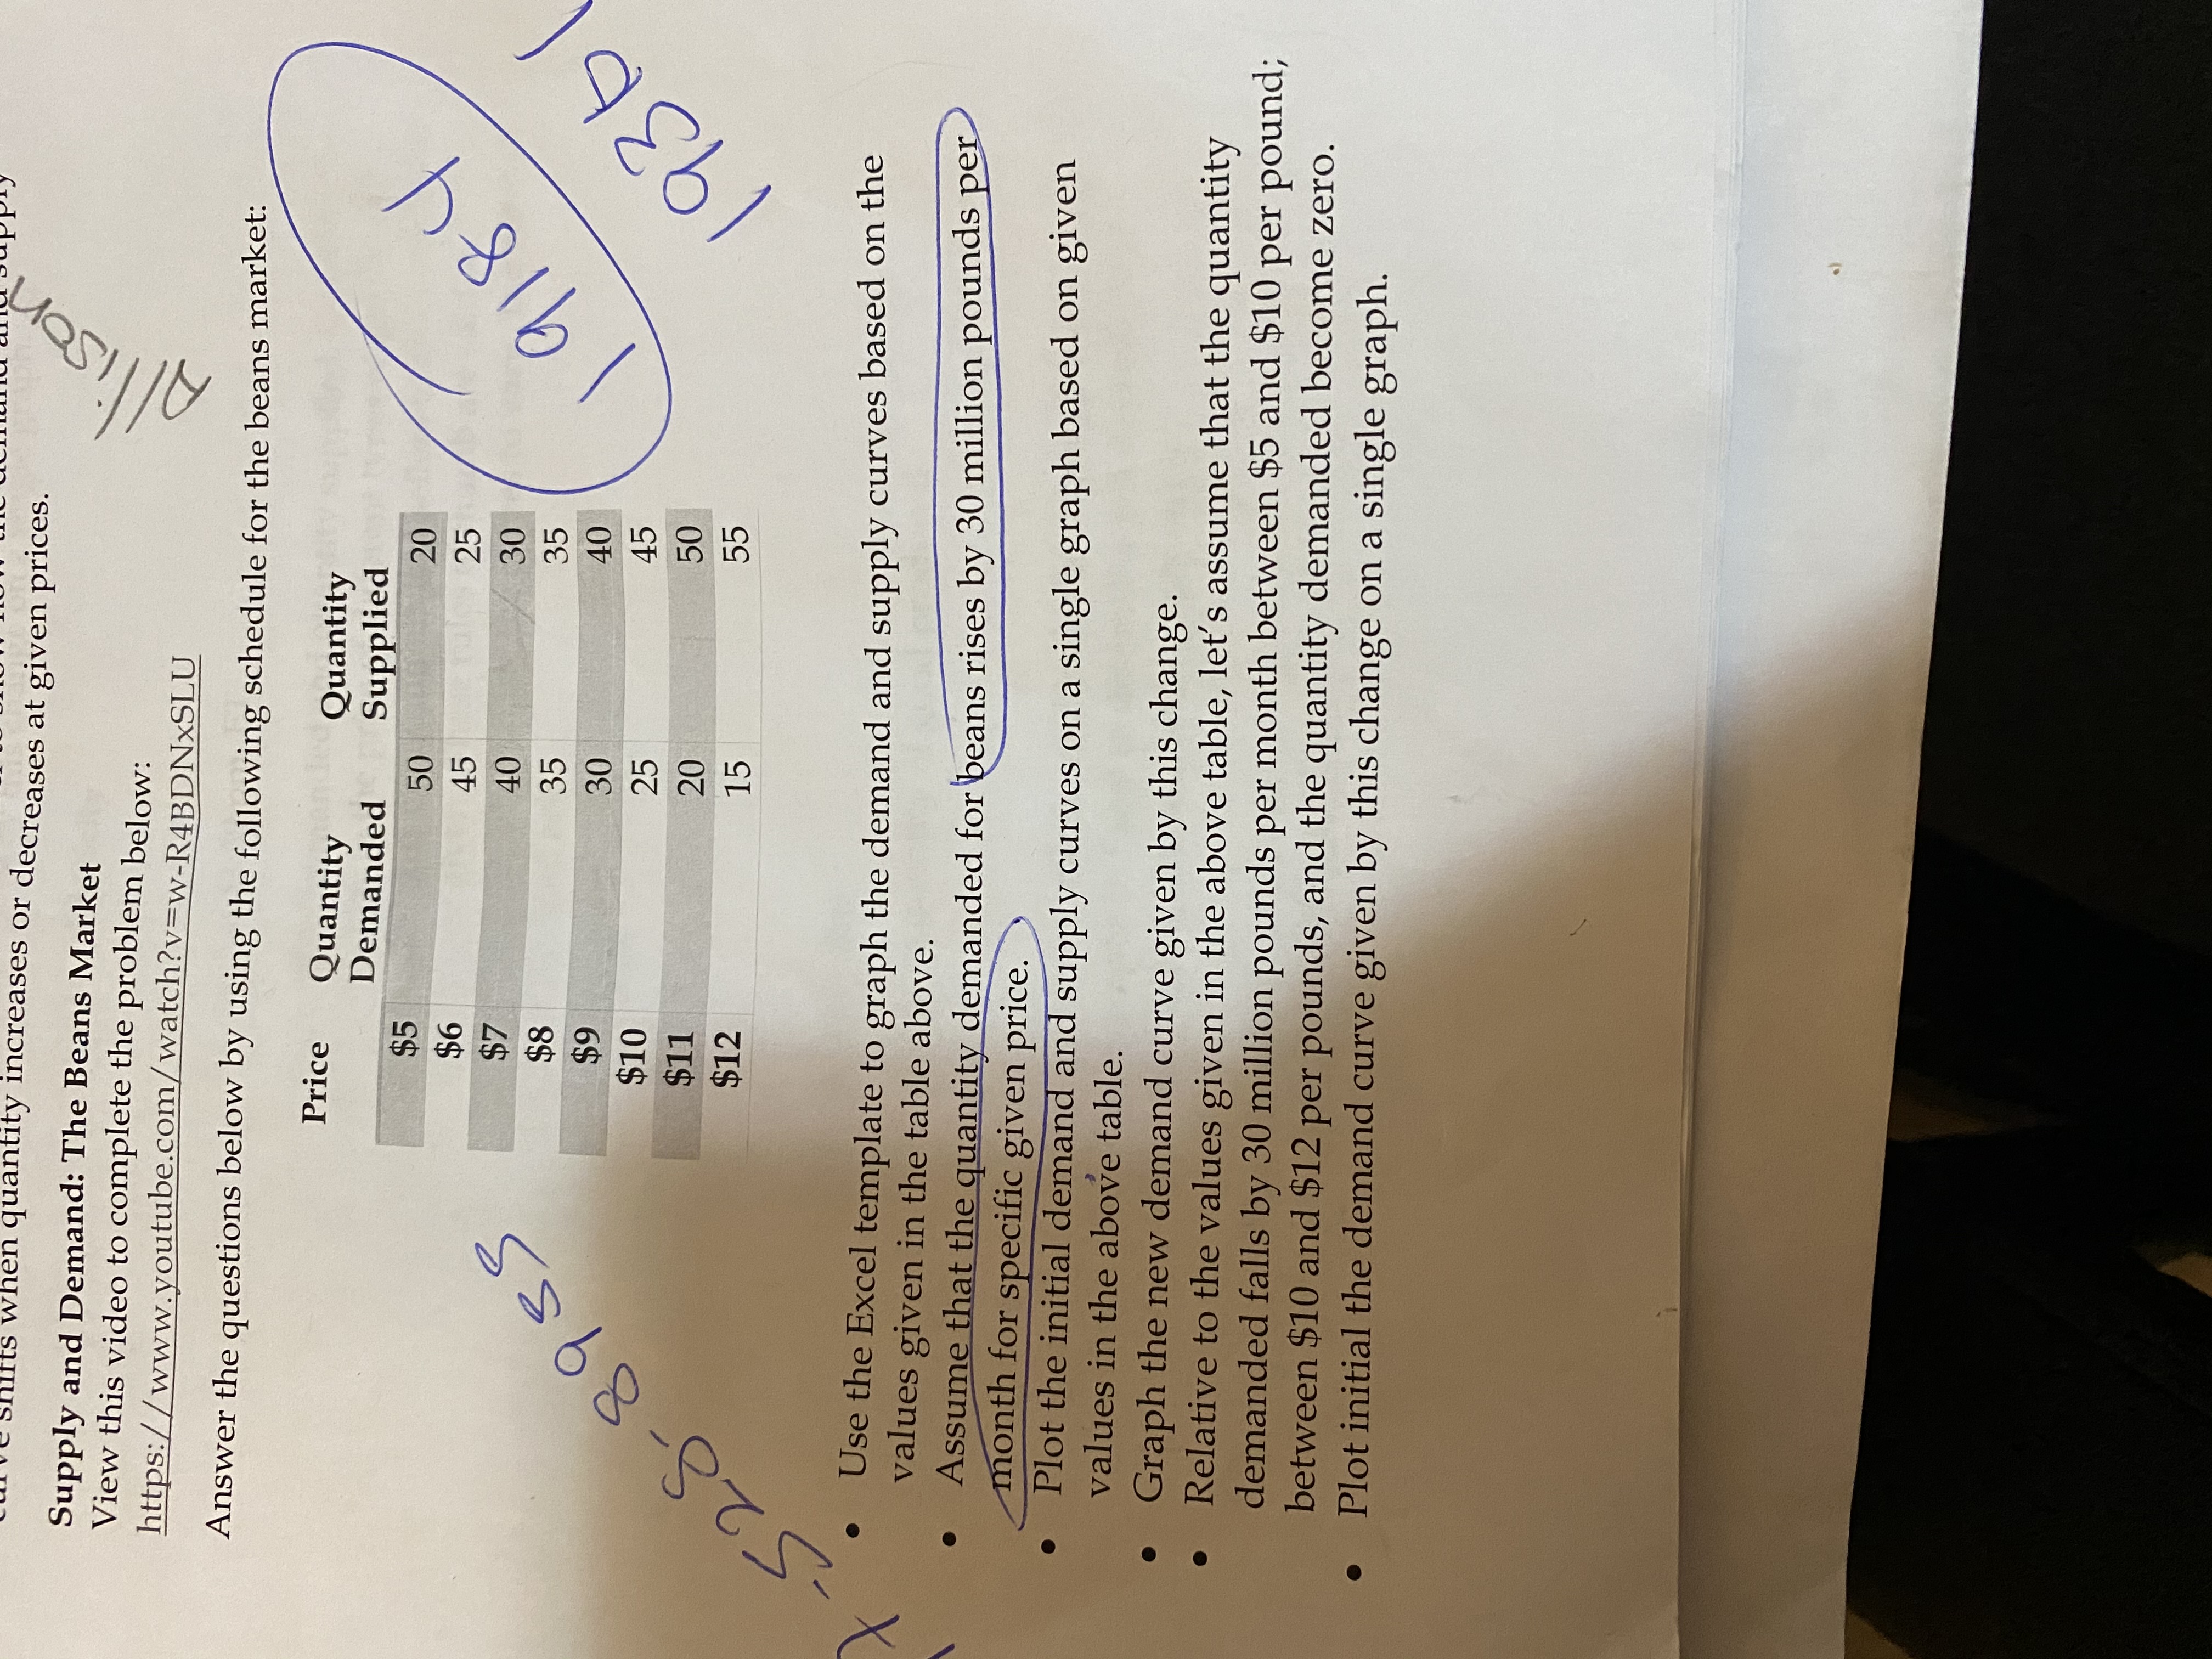
en quantity increases or decreases at given prices. Supply and Demand: The Beans Market View this video to complete the problem below: https://www.youtube.com/watch?v=w-R4BDNXSLU Alliso Answer the questions below by using the following schedule for the beans market: Price Quantity Demanded Quantity Supplied $5 50 20 $6 45 25 $7 40 30 $8 35 35 19184 28-8985 $9 30 40 $10 25 45 $11 20 50 $12 193 15 55 Use the Excel template to graph the demand and supply curves based on the values given in the table above. . Assume that the quantity demanded for beans rises by 30 million pounds per month for specific given price. . Plot the initial demand and supply curves on a single graph based on given values in the above table. . Graph the new demand curve given by this change. . Relative to the values given in the above table, let's assume that the quantity demanded falls by 30 million pounds per month between $5 and $10 per pound; between $10 and $12 per pounds, and the quantity demanded become zero. Plot initial the demand curve given by this change on a single graph.ECON195 - Portfolio Project Directions and Rubric 3 Graph the new demand curve given by this change. Assume that the quantity supplied for beans rises by 30 million pounds per month for specific given price, at the time the value for quantities supplied remain the same as shown in the table above. Plot initial demand and supply curves on a single graph based on given values in the above table. Graph the new supply curve given by this change. . Relative to the values given in the table above, let's assume that, the quantity supplied falls by 30 million pounds per month at prices above $8, at a price of $8 or less per pound and the quantity supplied becomes zero. . Plot the initial demand and supply curves based on the values given in the table above and new supply curve given by this change on a single graph. Week 3: Supply and Demand: Price Elasticity Problem #2 Due Date: Due by the end of Week 3 at 11:59 pm, ET. Price plays a significant role in quantity demanded and quantity supplied. Consumers and sellers respond differently to changes in the price of different types of goods and the situation. To measure the responsiveness of consumers and sellers to changes in the price of a good, some rules of thumb are given. These rules of thumb are said to fluence price elasticity of demand and supply making the curves to vary. The rules of numb that affect price elasticity of demand are: . Availability of a close substitute Necessities versus luxuries Definition of the market Time zone For price elasticity of supply, they are: Flexibility of sellers to cha