

Answered step by step
Verified Expert Solution
Question
1 Approved Answer
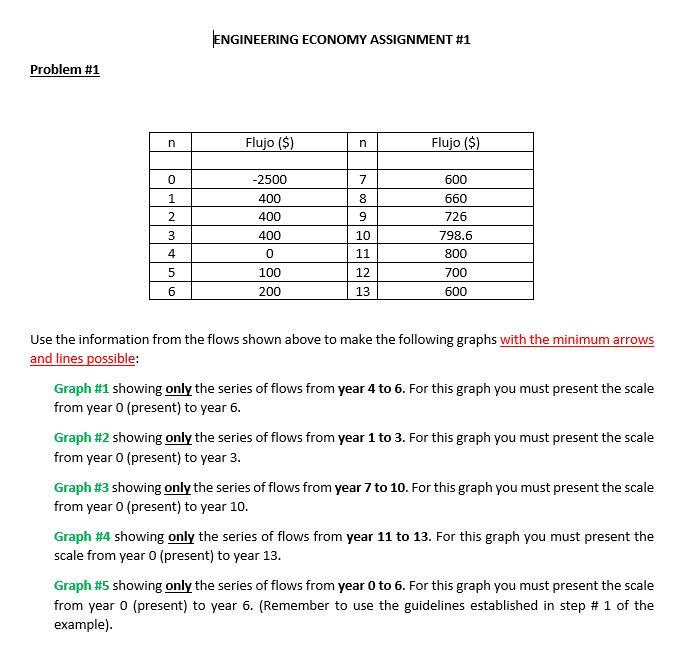
ENGINEERING ECONOMY ASSIGNMENT #1 Problem #1 n Flujo ($) n Flujo ($) 0 7 600 1 2 -2500 400 400 400 0 8 9 660
Step by Step Solution
There are 3 Steps involved in it
Step: 1

Get Instant Access to Expert-Tailored Solutions
See step-by-step solutions with expert insights and AI powered tools for academic success
Step: 2

Step: 3
Ace Your Homework with AI
Get the answers you need in no time with our AI-driven, step-by-step assistance
Get Started
Personal Finance In A Public World How Technology Social Media And Ads Affect Your Money Decisions
Authors: Bob DePasquale
1st Edition
1637306652, 978-1637306659