

Answered step by step
Verified Expert Solution
Question
1 Approved Answer
ENGR 1 7 3 1 Computing for Engineers Spring 2 0 2 4 > Lab 2 - MATLAB Basic - Variables, 1 - D Arrays
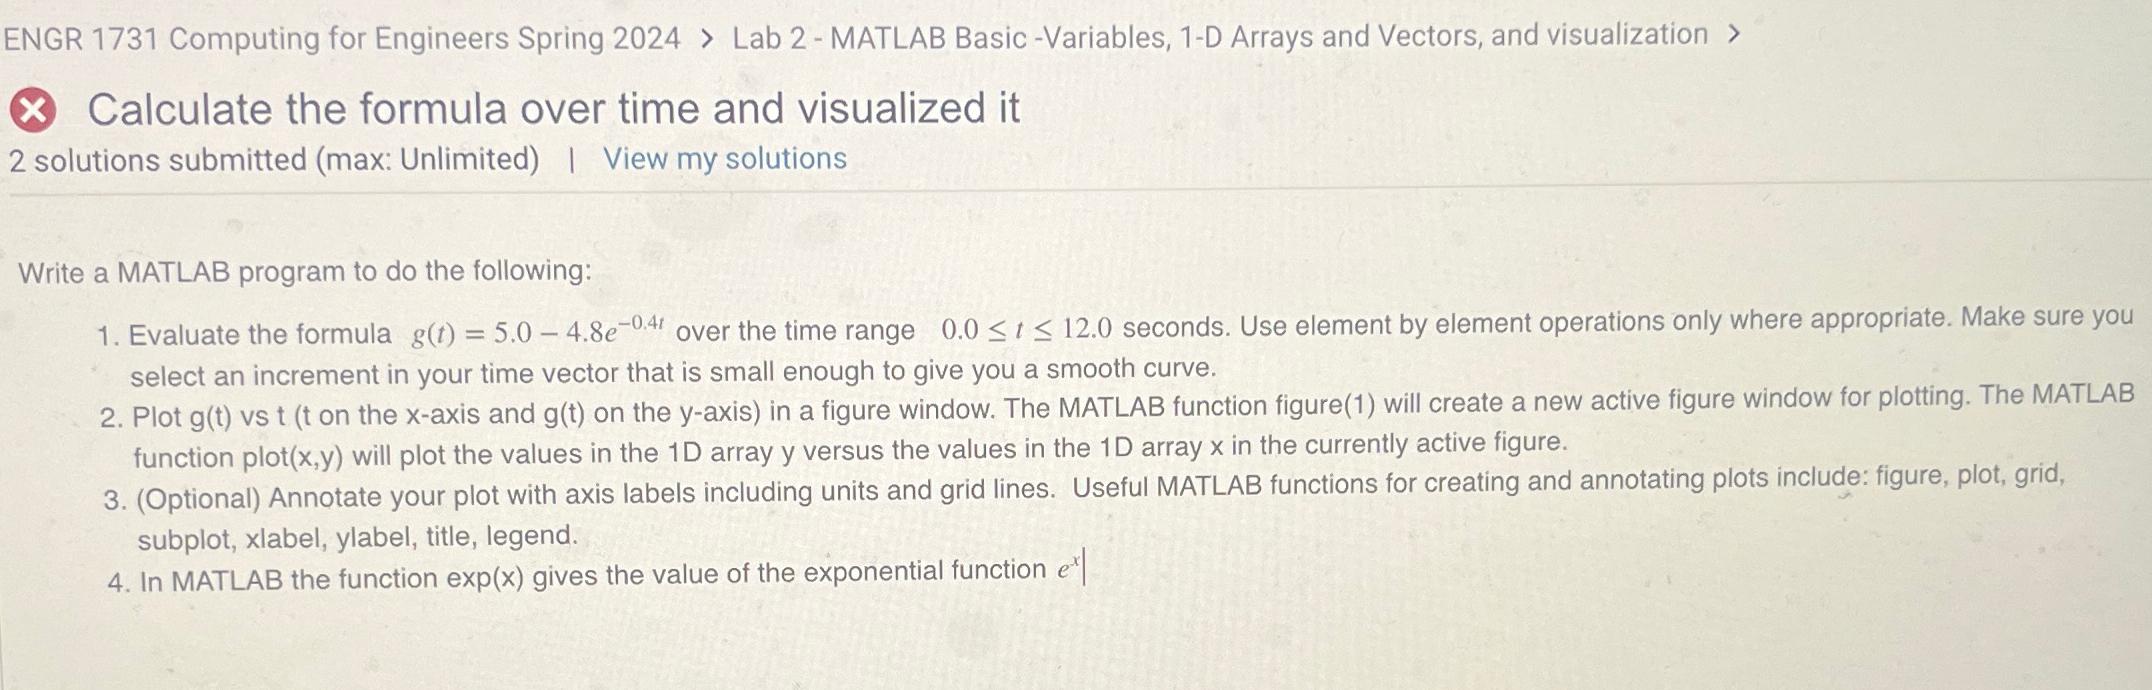
ENGR Computing for Engineers Spring Lab MATLAB BasicVariables, D Arrays and Vectors, and visualization
Calculate the formula over time and visualized it
solutions submitted max: Unlimited I View my solutions
Write a MATLAB program to do the following:
Evaluate the formula over the time range seconds. Use element by element operations only where appropriate. Make sure you select an increment in your time vector that is small enough to give you a smooth curve.
Plot vs on the axis and on the axis in a figure window. The MATLAB function figure will create a new active figure window for plotting. The MATLAB function plot will plot the values in the D array versus the values in the D array in the currently active figure.
Optional Annotate your plot with axis labels including units and grid lines. Useful MATLAB functions for creating and annotating plots include: figure, plot, grid, subplot, xlabel, ylabel, title, legend.
In MATLAB the function exp gives the value of the exponential function
Step by Step Solution
There are 3 Steps involved in it
Step: 1

Get Instant Access to Expert-Tailored Solutions
See step-by-step solutions with expert insights and AI powered tools for academic success
Step: 2

Step: 3
Ace Your Homework with AI
Get the answers you need in no time with our AI-driven, step-by-step assistance
Get Started
Directions In Databases 12th British National Conference On Databases Bncod 12 Guildford United Kingdom July 6 8 1994 Proceedings Lncs 826
Authors: David S. Bowers
1994th Edition
3540582355, 978-3540582359