Answered step by step
Verified Expert Solution
Link Copied!

Question

1 Approved Answer

ensure that the columns represented by x1, x2 and y are distinct numeric columns of census; also make sure that state1 and state2 are valid
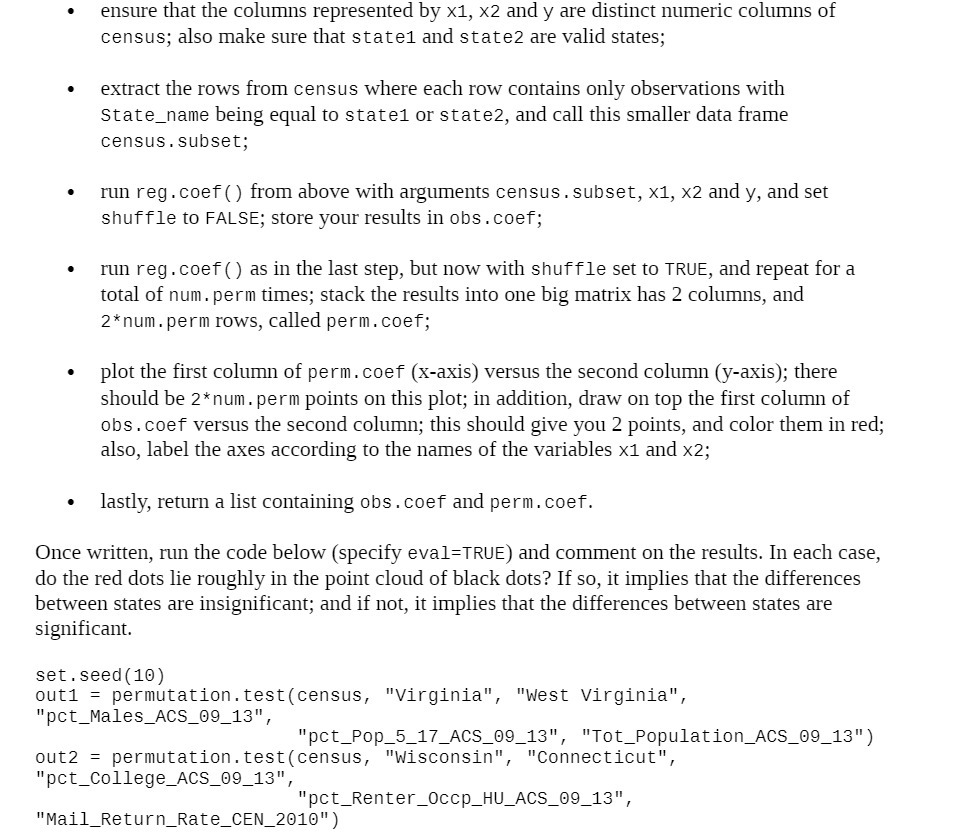
image text in transcribed
ensure that the columns represented by x1, x2 and y are distinct numeric columns of census; also make sure that state1 and state2 are valid states; extract the rows from census where each row contains only observations with State_name being equal to stated or state2, and call this smaller data frame census . subset; run reg . coef ( ) from above with arguments census . subset, x1, x2 and y, and set shuffle to FALSE; store your results in obs . coef; run reg . coef ( ) as in the last step, but now with shuffle set to TRUE, and repeat for a total of num. perm times; stack the results into one big matrix has 2 columns, and 2*num . perm rows, called perm. coef; . plot the first column of perm. coef (x-axis) versus the second column (y-axis); there should be 2*num . perm points on this plot; in addition, draw on top the first column of obs . coef versus the second column; this should give you 2 points, and color them in red; also, label the axes according to the names of the variables x1 and x2; . lastly, return a list containing obs . coef and perm. coef. Once written, run the code below (specify eval=TRUE) and comment on the results. In each case, do the red dots lie roughly in the point cloud of black dots? If so, it implies that the differences between states are insignificant; and if not, it implies that the differences between states are significant. set . seed (10) out1 = permutation . test (census, "Virginia", "West Virginia", "pct_Males_ACS_09_13" "pct_Pop_5_17_ACS_09_13", "Tot_Population_ACS_09_13") out2 = permutation. test (census, "Wisconsin", "Connecticut", "pct_College_ACS_09_13" "pct_Renter_Occp_HU_ACS_09_13", "Mail_Return_Rate_CEN_2010")

Step by Step Solution

There are 3 Steps involved in it

Step: 1

blur-text-image

Get Instant Access to Expert-Tailored Solutions

See step-by-step solutions with expert insights and AI powered tools for academic success

Step: 2

blur-text-image_2

Step: 3

blur-text-image_3

Ace Your Homework with AI

Get the answers you need in no time with our AI-driven, step-by-step assistance

Get Started

Recommended Textbook for

Understanding Financial Statements

Authors: Lyn FraserAlexa Fox, Judy Strauss, William Briggs, Mario Triola, S Certo, S. Certo, Philip Kotler, Robert Anthony, Barry Monk, Jaan Kiusalaas, R.C. Hi

10th Edition

0132655063, 9780132655064

More Books

Students also viewed these Mathematics questions

Question

What are some important provisions of the Fair Labor Standards Act?

Answered: 1 week ago