

Question
Enter data in MS Project and draw Optimistic, Pessimistic and Expected duration Gantt Charts. See which path is critical path ID Task name Predecessors Duration
Enter data in MS Project and draw Optimistic, Pessimistic and Expected duration Gantt Charts. See which path is critical path ID Task name Predecessors Duration ? Optimistic duration Expected duration Pessimistic duration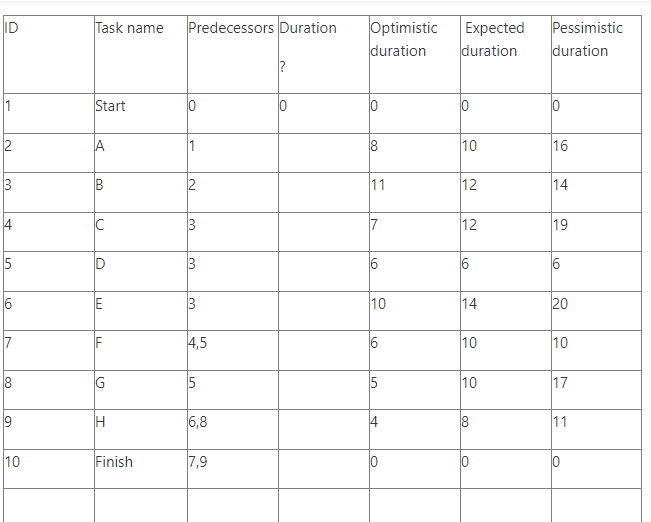
Step by Step Solution
There are 3 Steps involved in it
Step: 1

Get Instant Access to Expert-Tailored Solutions
See step-by-step solutions with expert insights and AI powered tools for academic success
Step: 2

Step: 3
Ace Your Homework with AI
Get the answers you need in no time with our AI-driven, step-by-step assistance
Get Started
Investments Analysis and Management
Authors: Charles P. Jones
12th edition
978-1118475904, 1118475909, 1118363299, 978-1118363294