

Question
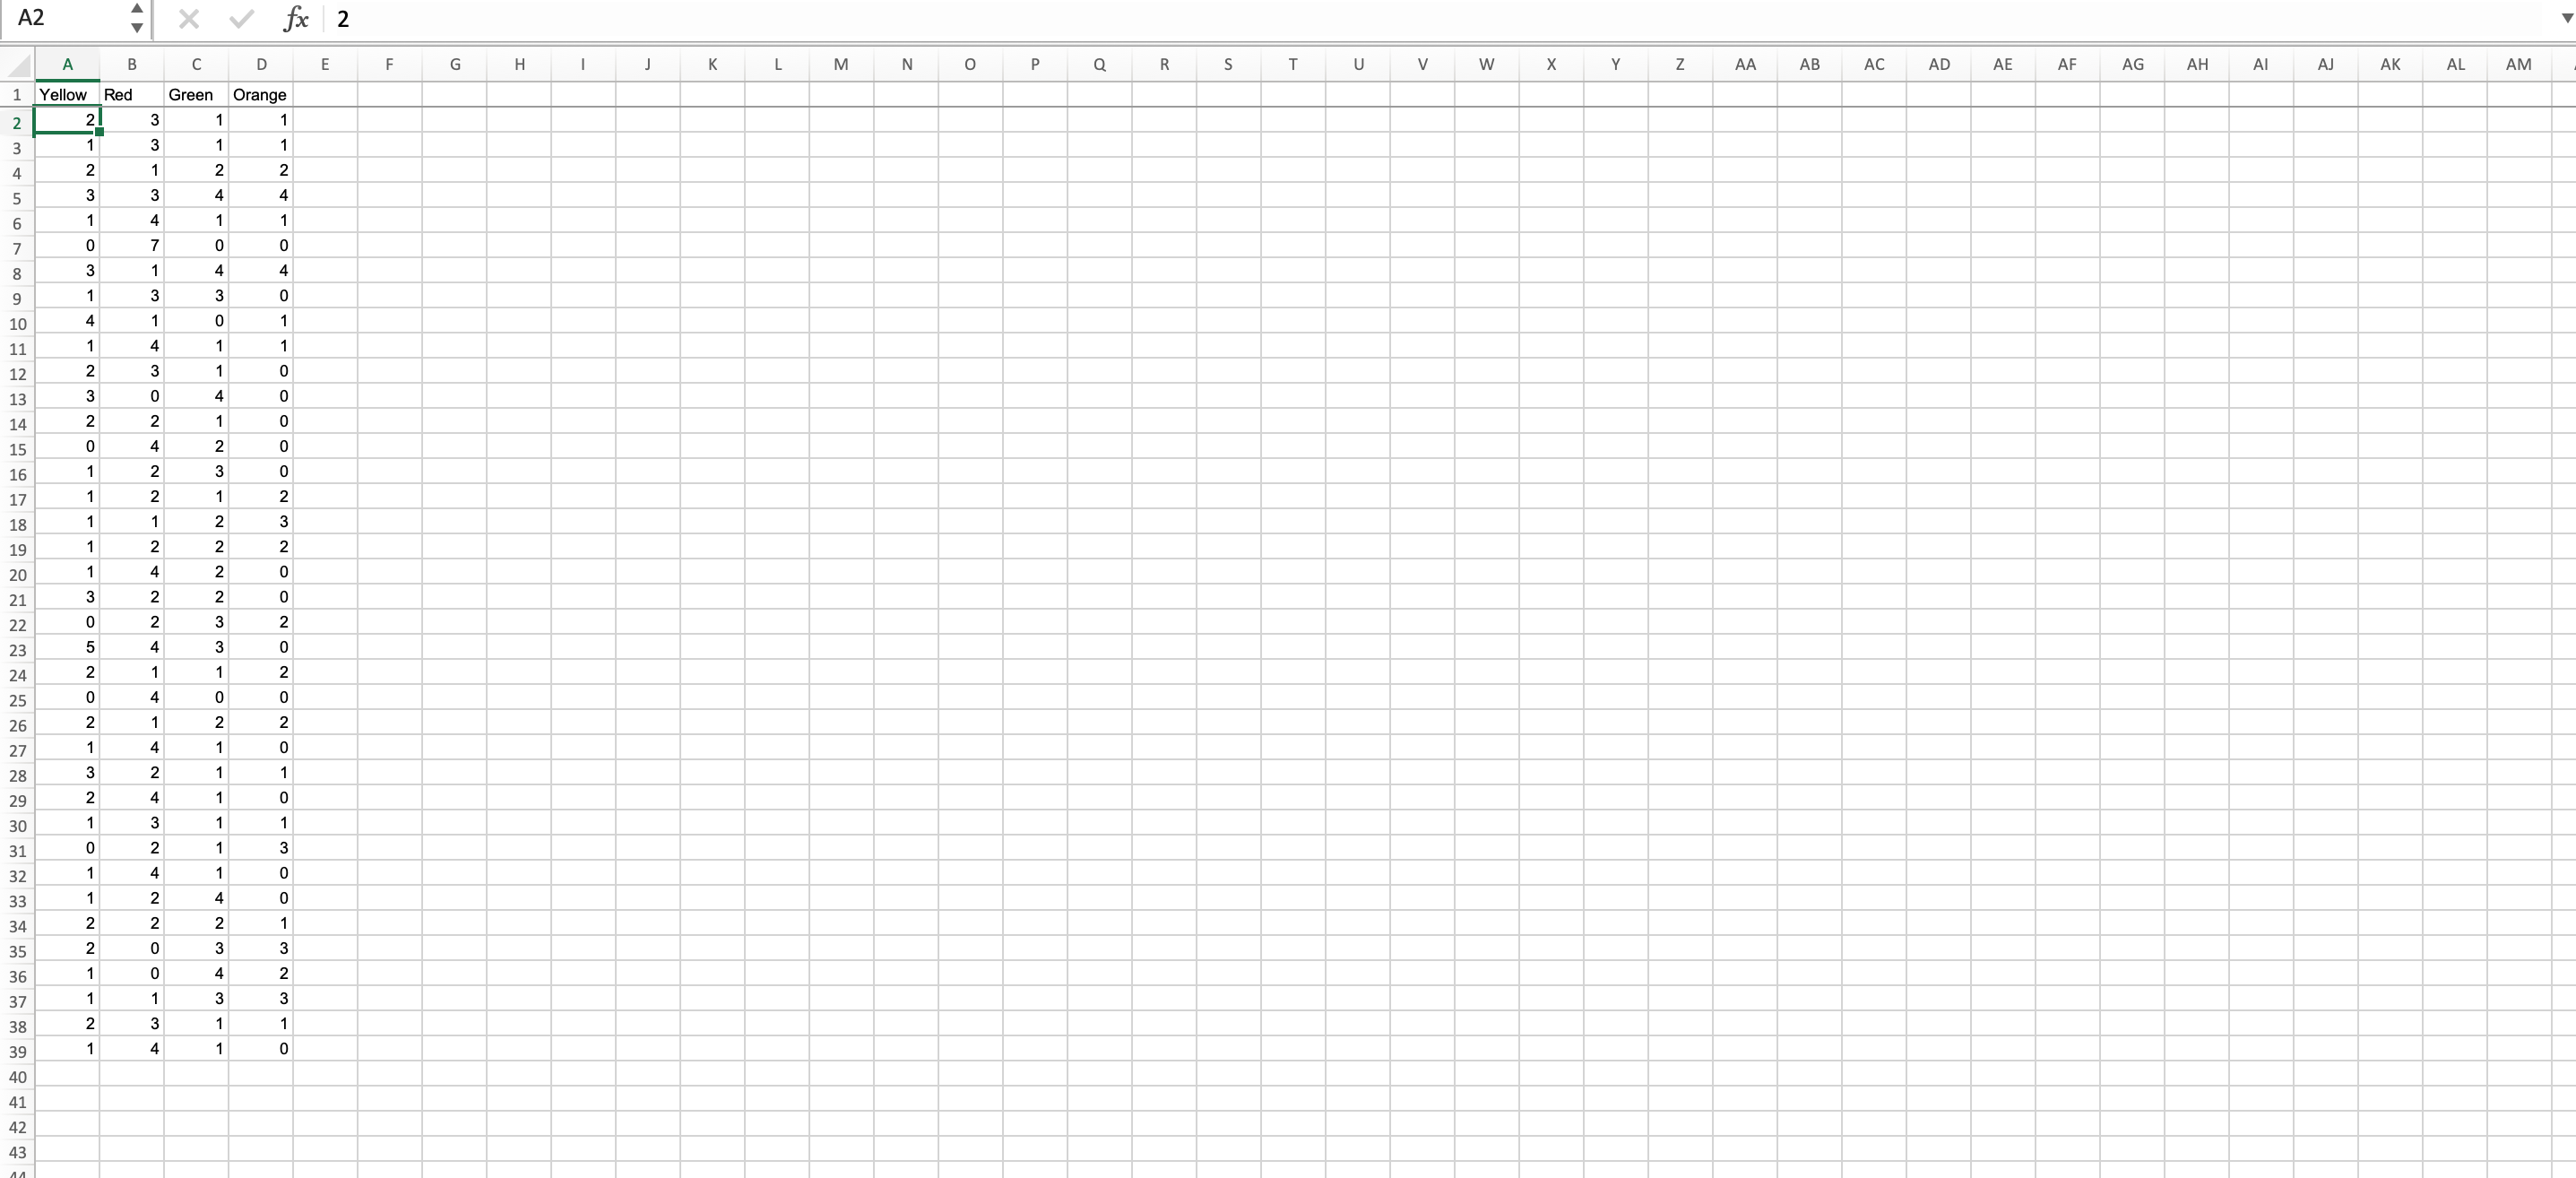
Enter the information in the image into excel to compute the following questions. The owner of Haribo hires you to perform some statistical analysis. The
Enter the information in the image into excel to compute the following questions.
The owner of Haribo hires you to perform some statistical analysis. The owner knows that producing one yellow gummy cost 1 cent. Also, the price for one red gummy is 1 cent. However, making one green gummy costs 5 cents, and producing one orange gummy costs 3 cents. These costs are well known in the company, and everyone refers to the yellow and red gummies as low-cost candy and orange and green as high-cost gummies. The marketing team developed a campaign to find out the gummy colors that clients prefer. Unsurprisingly, people prefer green and orange gummies. Hence, the marketing team wants to have those colors on every package. The team responsible for labeling the nutrition facts computes sugar and sodium content based on packages estimated to have seven gummies. Hence, the production team sets the machines to produce packages that are expected to have seven gummies. The financial team decided that the best way to minimize cost and fulfill the requirements of the marketing and nutrition teams is to produce packages expected to have one green and one orange gummy (high-cost group) and two yellow and three red gummies (low-cost candy).
Inference with Two Populations
a) What is the average proportion of low-cost candy per package? What is the standard deviation of the average proportion of low-cost candy per package?
b)What is the average proportion of high-cost gummies per package? What is the standard deviation of the average proportion of high-cost gummies per package?
c)Compute a 95% confidence interval for the difference in the proportions of low-cost candy and high-cost gummies per package.
d) If the production per package goes according to plan, what would be the expected proportion of low-cost candy per package?
e) If the production per package goes according to plan, what would be the expected proportion of high-cost gummies per package?
f) If the production per package goes according to plan, what would be the expected difference in the proportions of low-cost candy per package and high-cost gummies per package? Hint: The expected difference will be equal to the difference between the proportions used in question d) and question e).
Step by Step Solution
There are 3 Steps involved in it
Step: 1

Get Instant Access to Expert-Tailored Solutions
See step-by-step solutions with expert insights and AI powered tools for academic success
Step: 2

Step: 3
Ace Your Homework with AI
Get the answers you need in no time with our AI-driven, step-by-step assistance
Get Started
Applied Calculus
Authors: Stefan Waner, Steven Costenoble
6th Edition
1285415310, 9781285415314