Question
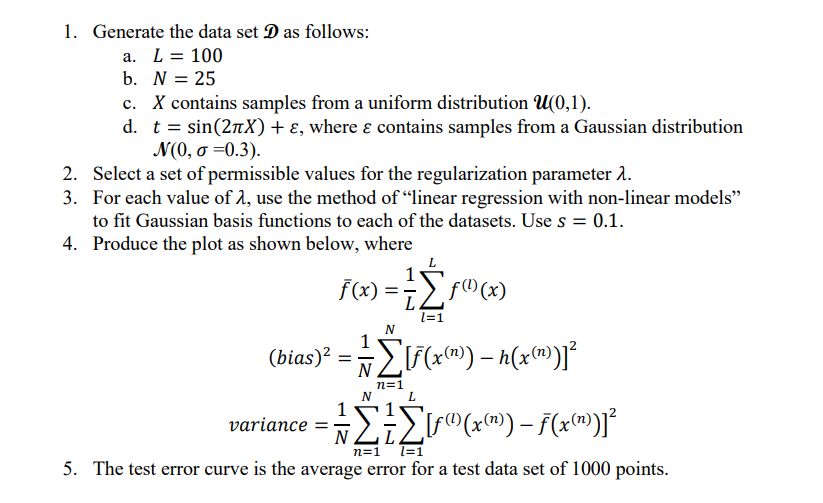
Error in Machine learning code I can not correct. Please help solve getting error Arrays have incompatible sizes for this operation. Error in Project3 (line
Error in Machine learning code I can not correct. Please help solve getting error
Arrays have incompatible sizes for this operation.
Error in Project3 (line 15) Phi_train = exp(-(X_train - mu').^2 / (2 * s^2));

L = 100; N = 25; X = rand(N, L);
t = sin(2 * pi * X) + 0.3 * randn(N, L);
lambda = [0.01, 0.1, 1];
s = 0.1;
M = 100; % Number of basis functions
X_test = rand(1000, 1);
for i = 1:length(lambda)
for j = 1:L
X_train = X(:, j);
t_train = t(:, j);
% % Constructing the design matrix using Gaussian basis functions
mu = linspace(0, 1, M);
Phi_train = exp(-(X_train - mu').^2 / (2 * s^2));
Phi_test = exp(-(X_test - mu').^2 / (2 * s^2));
%
% Solving for the weights using regularized least squares
w = (Phi_train * Phi_train' + lambda(i) * eye(M)) \ (Phi_train * t_train');
% Predicting the target values for the test data
t_test(:, j) = Phi_test * w;
end
% Computing the bias, variance, and test error for each value of lambda
f_bar = mean(t_test, 2);
bias_sq = mean((f_bar - sin(2 * pi * X_test)).^2);
variance = mean(mean((t_test - f_bar).^2));
test_error(i) = bias_sq + variance;
end
figure;
plot(log10(lambda), bias_sq * ones(size(lambda)), 'k--', 'LineWidth', 2);
hold on;
plot(log10(lambda), variance * ones(size(lambda)), 'k-.', 'LineWidth', 2);
plot(log10(lambda), test_error, 'k-', 'LineWidth', 2);
xlabel('log_{10}(\lambda)');
ylabel('Error');
legend('Bias^2', 'Variance', 'Test Error');
X_test = rand(1000, 1);
t_test = sin(2 * pi * X_test) + 0.3 * randn(1000, 1);
1. Generate the data set D as follows: a. L=100 b. N=25 c. X contains samples from a uniform distribution U(0,1). d. t=sin(2X)+, where contains samples from a Gaussian distribution N(0,=0.3) 2. Select a set of permissible values for the regularization parameter . 3. For each value of , use the method of "linear regression with non-linear models" to fit Gaussian basis functions to each of the datasets. Use s=0.1. 4. Produce the plot as shown below, where f(x)=L1l=1Lf(l)(x)(bias)2=N1n=1N[f(x(n))h(x(n))]2variance=N1n=1NL1l=1L[f(l)(x(n))f(x(n))]2 5. The test error curve is the average error for a test data set of 1000 pointsStep by Step Solution
There are 3 Steps involved in it
Step: 1

Get Instant Access to Expert-Tailored Solutions
See step-by-step solutions with expert insights and AI powered tools for academic success
Step: 2

Step: 3

Ace Your Homework with AI
Get the answers you need in no time with our AI-driven, step-by-step assistance
Get Started


