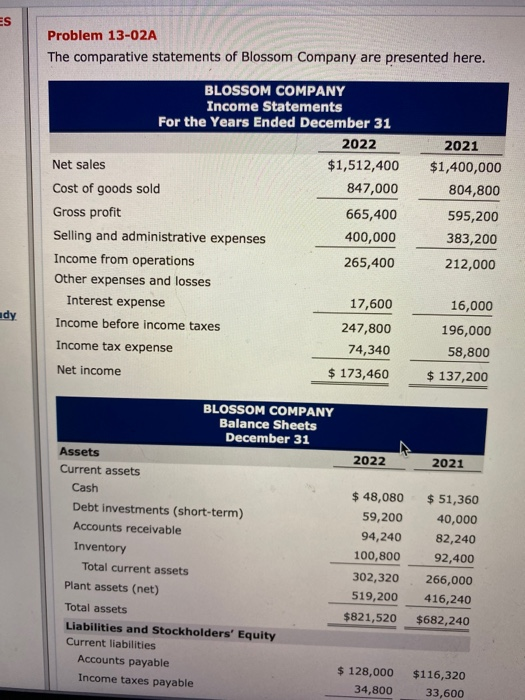
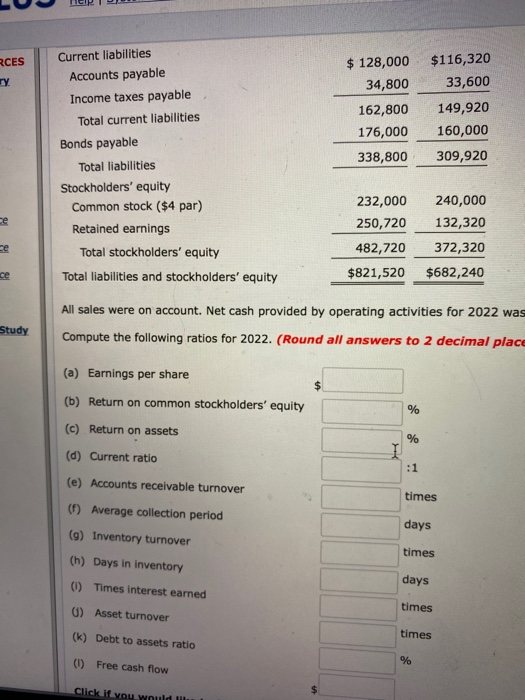
ES Problem 13-02A The comparative statements of Blossom Company are presented here. BLOSSOM COMPANY Income Statements For the Years Ended December 31 2022 Net sales $1,512,400 Cost of goods sold 847,000 Gross profit 665,400 Selling and administrative expenses 400,000 Income from operations 265,400 Other expenses and losses Interest expense 17,600 Income before income taxes 247,800 Income tax expense 74,340 Net income $ 173,460 2021 $1,400,000 804,800 595,200 383,200 212,000 ady 16,000 196,000 58,800 $ 137,200 BLOSSOM COMPANY Balance Sheets December 31 2022 2021 Assets Current assets Cash Debt investments (short-term) Accounts receivable Inventory Total current assets Plant assets (net) Total assets Liabilities and Stockholders' Equity Current liabilities Accounts payable Income taxes payable $ 48,080 59,200 94,240 100,800 302,320 519,200 $821,520 $ 51,360 40,000 82,240 92,400 266,000 416,240 $682,240 $ 128,000 34,800 $116,320 33,600 RCES $116,320 33,600 $ 128,000 34,800 162,800 176,000 338,800 149,920 160,000 309,920 Current liabilities Accounts payable Income taxes payable Total current liabilities Bonds payable Total liabilities Stockholders' equity Common stock ($4 par) Retained earnings Total stockholders' equity Total liabilities and stockholders' equity 240,000 132,320 ce 232,000 250,720 482,720 $821,520 ce 372,320 ce $682,240 All sales were on account. Net cash provided by operating activities for 2022 was Study Compute the following ratios for 2022. (Round all answers to 2 decimal place (a) Earnings per share (b) Return on common stockholders' equity % (c) Return on assets % (d) Current ratio :1 (e) Accounts receivable turnover (1) Average collection period times days (9) Inventory turnover times (h) Days in Inventory (1) Times interest earned days 6) Asset turnover times (k) Debt to assets ratio times (1) Free cash flow % Click if you would li $