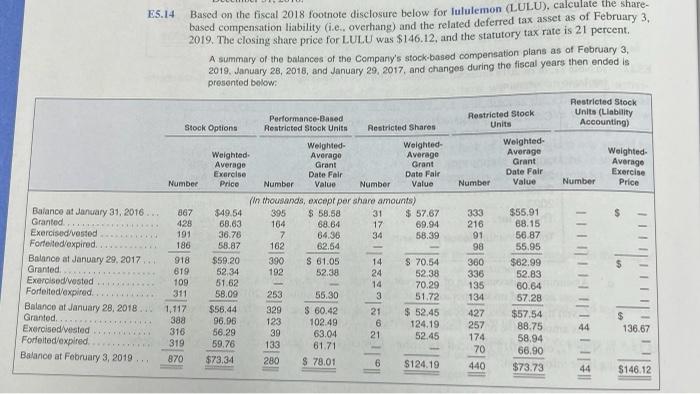
ES.14 Based on the fiscal 2018 footnote disclosure below for lululemon (LULU), calculate the share- based compensation liability (i.e.. overhang) and the related deferred tax asset as of February 3, 2019. The closing share price for LULU was $146.12, and the statutory tax rate is 21 percent. A summary of the balances of the Company's stock-based compensation plans as of February 3, 2019. January 28, 2018, and January 29, 2017, and changes during the fiscal years then ended is presented below: Restricted Stock Units (Liability Accounting) Performance-Based Restricted Stock Units Restricted Stock. Units Restricted Shares Weighted- Average Grant Date Fair Value Number Number (In thousands, except per share amounts) 395 $ 58.58 164 68.64 7 64.36 162 62.54 390 $ 61.05 192 52.38 253 55.30 329 $ 60.42 123 102.49 39 63.04 133 61.71 280 $ 78.01 Stock Options Number 867 428 191 186 Balance at January 31, 2016... Granted. Exercised/vested Forfeited/expired. 918 Balance at January 29, 2017... Granted. 619 Exercised/vested 109 Forfeited/expired... 311 Balance at January 28, 2018... 1,117 Granted..... 388 Exercised/vested 316 ******** Forfeited/expired. 319 Balance at February 3, 2019... 870 Weighted. Average Exercise Price $49.54 68.63 36,76 58.87 $59.20 52,34 51.62 58.09 $56.44 96.96 56.29 59.76 $73.34 Weighted- Average Grant Date Fair Value 31 $ 57.67 17 69.94 34 58.39 14 $ 70.54 24 52.38 14 70.29 51.72 $ 52.45 124.19 21 52.45 6 $124.19 3 21 6 Number 333 216 91 98 360 336 135 134 427 257 174 70 440 Weighted- Average Grant Date Fair Value $55.91 68.15 56.87 55.95 $62,99 52.83 60.64 57.28 $57.54 88.75 58.94 66.90 $73.73 Number Weighted- Average Exercise Price 27 1211311 FITTIT 44 II 161 136.67 44 $146.12 ES.14 Based on the fiscal 2018 footnote disclosure below for lululemon (LULU), calculate the share- based compensation liability (i.e.. overhang) and the related deferred tax asset as of February 3, 2019. The closing share price for LULU was $146.12, and the statutory tax rate is 21 percent. A summary of the balances of the Company's stock-based compensation plans as of February 3, 2019. January 28, 2018, and January 29, 2017, and changes during the fiscal years then ended is presented below: Restricted Stock Units (Liability Accounting) Performance-Based Restricted Stock Units Restricted Stock. Units Restricted Shares Weighted- Average Grant Date Fair Value Number Number (In thousands, except per share amounts) 395 $ 58.58 164 68.64 7 64.36 162 62.54 390 $ 61.05 192 52.38 253 55.30 329 $ 60.42 123 102.49 39 63.04 133 61.71 280 $ 78.01 Stock Options Number 867 428 191 186 Balance at January 31, 2016... Granted. Exercised/vested Forfeited/expired. 918 Balance at January 29, 2017... Granted. 619 Exercised/vested 109 Forfeited/expired... 311 Balance at January 28, 2018... 1,117 Granted..... 388 Exercised/vested 316 ******** Forfeited/expired. 319 Balance at February 3, 2019... 870 Weighted. Average Exercise Price $49.54 68.63 36,76 58.87 $59.20 52,34 51.62 58.09 $56.44 96.96 56.29 59.76 $73.34 Weighted- Average Grant Date Fair Value 31 $ 57.67 17 69.94 34 58.39 14 $ 70.54 24 52.38 14 70.29 51.72 $ 52.45 124.19 21 52.45 6 $124.19 3 21 6 Number 333 216 91 98 360 336 135 134 427 257 174 70 440 Weighted- Average Grant Date Fair Value $55.91 68.15 56.87 55.95 $62,99 52.83 60.64 57.28 $57.54 88.75 58.94 66.90 $73.73 Number Weighted- Average Exercise Price 27 1211311 FITTIT 44 II 161 136.67 44 $146.12


