

Question
essentials of investments- Bodie, Kane and Marcus ch13. ps26 recalculate the GE's intrinsic value using the fcf model in spreadsheet 13.2 / each scenario is
essentials of investments- Bodie, Kane and Marcus ch13. ps26
recalculate the GE's intrinsic value using the fcf model in spreadsheet 13.2 / each scenario is treated as independent
a. GE's P/E ratio in 2018 (cell G3) is 15.5 b. GE's current beta (cell B21) is 1.10 c. market risk premium (cell B27) is 8.5%
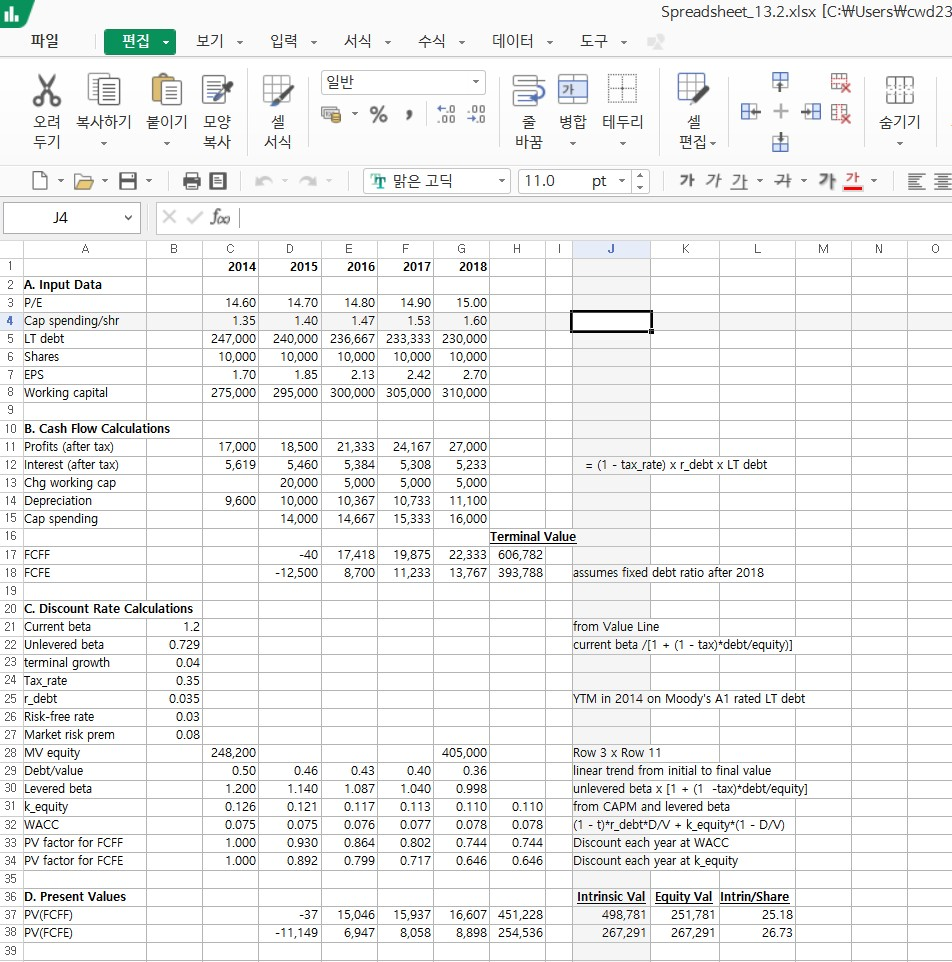
Spreadsheet 13.2.xlsx [C:WUserstcwd23 il. tiH .00 00 +0 L T 11.0 pt X Joo J4 M A D F G K N 1 2014 2015 2017 2018 2016 2 A. Input Data 14.60 14.70 3 P/E 14.80 14.90 15.00 4 Cap spending/shr 1.40 1.60 1.35 1.47 1.53 5 LT debt 247,000 240,000 236,667 233,333 230,000 10,000 6 Shares 10,000 10,000 10,000 10,000 7 EPS 1.70 1.85 2.13 2.42 2.70 8 Working capital 295,000 300,000 305,000 310,000 275,000 9 10 B. Cash Flow Calculations 27,000 11 Profits (after tax) 17,000 18,500 21,333 24,167 12 Interest (after tax) 13 Chg working cap 5,619 5,460 (1 tax_rate) x r_debt x LT debt 5,384 5,308 5,233 5,000 11,100 20,000 5,000 5,000 14 Depreciation 9,600 10,000 10,367 10,733 15 Cap spending 14,000 14.667 15.333 16,000 16 Terminal Value -40 22,333 606,782 17 FCFF 17.418 19.875 8,700 13,767 393,788 assumes fixed debt ratio after 2018 18 FCFE -12,500 11,233 19 20 C. Discount Rate Calculations 21 Current beta from Value Line 1.2 current beta /[1 (1 tax) debt/equity)] 22 Unlevered beta 0.729 23 terminal growth 0.04 24 Tax rate 0.35 25 r debt YTM in 2014 on Moody's A1 rated LT debt 0.035 26 Risk-free rate 0.03 27 Market risk prem 0.08 28 MV equity 29 Debt/value 248,200 405,000 Row 3 x Row 11 0.50 0.46 0.40 linear trend from initial to final value 0.43 0.36 1.040 1.200 0.126 unlevered beta x [1 (1 30 Levered beta -tax)*debt/equity] 1.140 1.087 0.998 31 k equity 0.121 0.113 from CAPM and levered beta 0.117 0.110 0.110 (1 - t)r_debt D/ k equity*(1 D/M) Discount each year at WACC Discount each year at k equity 0.075 0.075 0.077 32 WACC 0.076 0.078 0.078 0.744 0.646 33 PV factor for FCFF 1.000 0.930 0.864 0.802 0.744 34 PV factor for FCFE 1.000 0.892 0.799 0.717 0.646 35 36 D. Present Values Intrinsic Val Equity Val Intrin/Share 16,607 451,228 8,898 254,536 37 PV(FCFF) -37 15,046 15,937 498,781 251,781 25.18 38 PV(FCFE) 8,058 -11,149 6,947 267,291 267,291 26.73 39 Spreadsheet 13.2.xlsx [C:WUserstcwd23 il. tiH .00 00 +0 L T 11.0 pt X Joo J4 M A D F G K N 1 2014 2015 2017 2018 2016 2 A. Input Data 14.60 14.70 3 P/E 14.80 14.90 15.00 4 Cap spending/shr 1.40 1.60 1.35 1.47 1.53 5 LT debt 247,000 240,000 236,667 233,333 230,000 10,000 6 Shares 10,000 10,000 10,000 10,000 7 EPS 1.70 1.85 2.13 2.42 2.70 8 Working capital 295,000 300,000 305,000 310,000 275,000 9 10 B. Cash Flow Calculations 27,000 11 Profits (after tax) 17,000 18,500 21,333 24,167 12 Interest (after tax) 13 Chg working cap 5,619 5,460 (1 tax_rate) x r_debt x LT debt 5,384 5,308 5,233 5,000 11,100 20,000 5,000 5,000 14 Depreciation 9,600 10,000 10,367 10,733 15 Cap spending 14,000 14.667 15.333 16,000 16 Terminal Value -40 22,333 606,782 17 FCFF 17.418 19.875 8,700 13,767 393,788 assumes fixed debt ratio after 2018 18 FCFE -12,500 11,233 19 20 C. Discount Rate Calculations 21 Current beta from Value Line 1.2 current beta /[1 (1 tax) debt/equity)] 22 Unlevered beta 0.729 23 terminal growth 0.04 24 Tax rate 0.35 25 r debt YTM in 2014 on Moody's A1 rated LT debt 0.035 26 Risk-free rate 0.03 27 Market risk prem 0.08 28 MV equity 29 Debt/value 248,200 405,000 Row 3 x Row 11 0.50 0.46 0.40 linear trend from initial to final value 0.43 0.36 1.040 1.200 0.126 unlevered beta x [1 (1 30 Levered beta -tax)*debt/equity] 1.140 1.087 0.998 31 k equity 0.121 0.113 from CAPM and levered beta 0.117 0.110 0.110 (1 - t)r_debt D/ k equity*(1 D/M) Discount each year at WACC Discount each year at k equity 0.075 0.075 0.077 32 WACC 0.076 0.078 0.078 0.744 0.646 33 PV factor for FCFF 1.000 0.930 0.864 0.802 0.744 34 PV factor for FCFE 1.000 0.892 0.799 0.717 0.646 35 36 D. Present Values Intrinsic Val Equity Val Intrin/Share 16,607 451,228 8,898 254,536 37 PV(FCFF) -37 15,046 15,937 498,781 251,781 25.18 38 PV(FCFE) 8,058 -11,149 6,947 267,291 267,291 26.73 39
Step by Step Solution
There are 3 Steps involved in it
Step: 1

Get Instant Access to Expert-Tailored Solutions
See step-by-step solutions with expert insights and AI powered tools for academic success
Step: 2

Step: 3
Ace Your Homework with AI
Get the answers you need in no time with our AI-driven, step-by-step assistance
Get Started
Blockchain Real World Applications And Understanding How Blockchain Can Be Applied In Your World
Authors: Wayne Walker
1st Edition
1091858586, 978-1091858589