Answered step by step
Verified Expert Solution
Question
1 Approved Answer
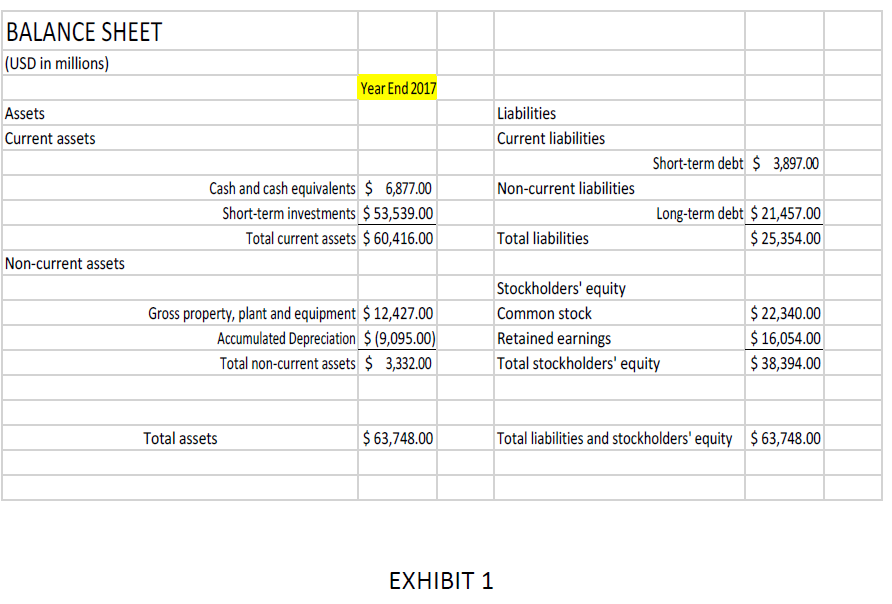
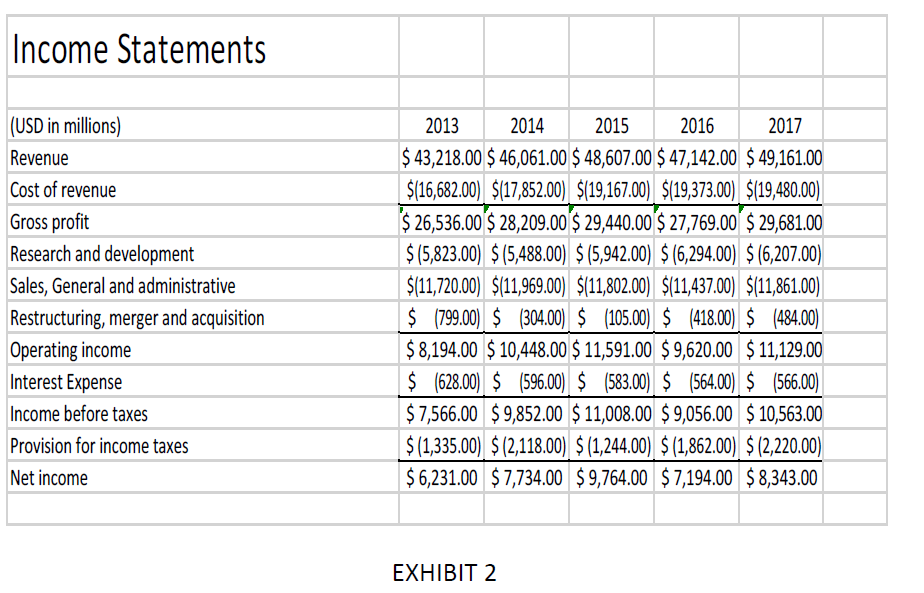
Estimate Free Cash Flow for the next 5 years assuming depreciation of 5% of sales and capital expenditures of 4% of Sales. BALANCE SHEET (USD
Estimate Free Cash Flow for the next 5 years assuming depreciation of 5% of sales and capital expenditures of 4% of Sales.


BALANCE SHEET (USD in millions) Year End 2017 Liabilities Current liabilities Assets Current assets Short-term debt 3,897.00 Cash and cash equivalents $6,877.00 Short-term investments 53,539.00 Total current assets $ 60,416.00 Non-current liabilities Long-term debt $21,457.00 $25,354.00 Total liabilities Non-current assets Stockholders' equity Common stock Retained earnings Total stockholders' equity Gross property, plant and equipment $ 12,427.00 Accumulated Depreciation (9,095.00) Total non-current assets 3,332.00 22,340.00 $16,054.00 38,394.00 $63,748.00 $63,748.00 Total liabilities and stockholders' equity Total assets EXHIBIT 1 Income Statements (USD in millions) Revenue Cost of revenue Gross profit Research and development Sales, General and administrative Restructuring, merger and acquisition Operating income Interest Expense Income before taxes Provision for income taxes Net income 2013201420152016 43,218.00 $ 46,061.00 $48,607.00 $47,142.00 $49,161.00 $(16,682.00 $(17,852.00) $(19,167.00) $19,373.00) $19,480.00) $26,536.00 $ 28,209.00$29,440.00$27,769.00 $29,681.00 $(5,823.00) $(5,488.00) $(5,942.00) $(6,294.00) (6,207.00) $(11,720.00) $(11969.00) $(11,802.00) $(11437.00 $(11,861.00 $799.00$ 304.00 $ (105.00) $ (418.00) $ 484.00) 8,194.00 $10,448.00 $11,591.00 $9,620.00 $11,129.00 $ (628.00 $ (596.00) $ (583.00) $ (564.00)$ (566.00) $7,566.00 $9,852.00 $11,008.00 $9,056.00 $10,563.00 $(1,335.00) $(2,118.00) $(1,244.00) $(1,862.00) $(2,220.00) 6,231.00 $7,734.00 $9,764.00 $7,194.00 $8,343.00 2017 EXHIBIT 2 BALANCE SHEET (USD in millions) Year End 2017 Liabilities Current liabilities Assets Current assets Short-term debt 3,897.00 Cash and cash equivalents $6,877.00 Short-term investments 53,539.00 Total current assets $ 60,416.00 Non-current liabilities Long-term debt $21,457.00 $25,354.00 Total liabilities Non-current assets Stockholders' equity Common stock Retained earnings Total stockholders' equity Gross property, plant and equipment $ 12,427.00 Accumulated Depreciation (9,095.00) Total non-current assets 3,332.00 22,340.00 $16,054.00 38,394.00 $63,748.00 $63,748.00 Total liabilities and stockholders' equity Total assets EXHIBIT 1 Income Statements (USD in millions) Revenue Cost of revenue Gross profit Research and development Sales, General and administrative Restructuring, merger and acquisition Operating income Interest Expense Income before taxes Provision for income taxes Net income 2013201420152016 43,218.00 $ 46,061.00 $48,607.00 $47,142.00 $49,161.00 $(16,682.00 $(17,852.00) $(19,167.00) $19,373.00) $19,480.00) $26,536.00 $ 28,209.00$29,440.00$27,769.00 $29,681.00 $(5,823.00) $(5,488.00) $(5,942.00) $(6,294.00) (6,207.00) $(11,720.00) $(11969.00) $(11,802.00) $(11437.00 $(11,861.00 $799.00$ 304.00 $ (105.00) $ (418.00) $ 484.00) 8,194.00 $10,448.00 $11,591.00 $9,620.00 $11,129.00 $ (628.00 $ (596.00) $ (583.00) $ (564.00)$ (566.00) $7,566.00 $9,852.00 $11,008.00 $9,056.00 $10,563.00 $(1,335.00) $(2,118.00) $(1,244.00) $(1,862.00) $(2,220.00) 6,231.00 $7,734.00 $9,764.00 $7,194.00 $8,343.00 2017 EXHIBIT 2
Step by Step Solution
There are 3 Steps involved in it
Step: 1

Get Instant Access to Expert-Tailored Solutions
See step-by-step solutions with expert insights and AI powered tools for academic success
Step: 2

Step: 3

Ace Your Homework with AI
Get the answers you need in no time with our AI-driven, step-by-step assistance
Get Started


