 Estimate the cost of equity thereby using the CAPM as well as the cost of debt thereby using Microsoft Excel. Using the Weighted Average Cost of Capital (WACC), they have to discount the forecasted free cash flows To find the intrinsic value of the company. Based on the findings, they have to illustrate their knowledge to interpret beta and evaluate whether the company is over- or undervalued. Please help me step-by-step, I need to understand how to do it in excel. thank you
-
Financial Analysis of Pfizer *PFE* company:
-
Estimate the cost of equity?
-
What's the WACC? i NEED STEP BY STEP, DONT KNOW IF I DID RIGHT
-
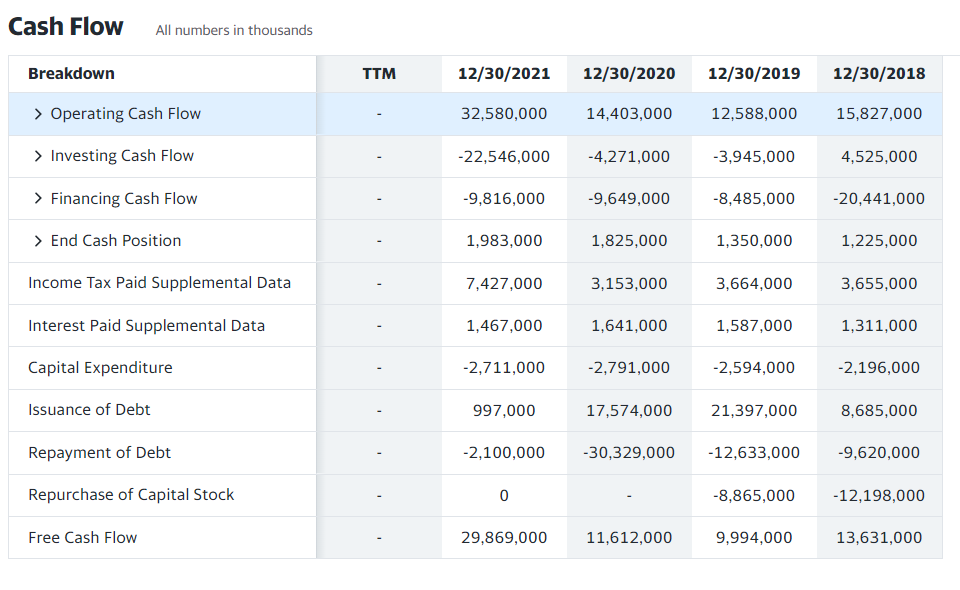
How were the FCFs forecasted?
-
Interpretation of BETA.
- Is the company over- or undervalued? Explain why, using different scenarios, changing the factors, and margin of safety.
| | Estimate Cost of Equity | | |
| | | |
| | Cost of Equity | Low | High |
| | Selected Beta | 0,66 | 0,81 |
| | (x) Country Market Risk Premium | 4,2% | 4,2% |
| | Adjusted Market Risk Premium | 2,8% | 3,4% |
| | | |
| | (+) Risk-free Rate | 3,00% | 3,50% |
| | (+) Additional Risk Adjustments | 0,13% | 0,25% |
| | | |
| | Cost of Equity | 6,00% | 7,25% |
| | | |
| | | | |
| | Calculate a Weighted Average Range | | | |
| | | | |
| | Cost Estimates | | | |
| | Cost of Equity | 6,00% | 7,25% | |
| | After-tax Cost of Debt | 3,40% | 3,83% | |
| | | | |
| | Weights | | | |
| | Equity % of Capital | 90,0% | 85,0% | |
| | Debt % of Capital | 10,0% | 15,0% | |
| | | | |
| | WACC Range | 5,75% | 6,75% | |
| | | | |
| | Selected WACC | 6,25% | | |
| | | | |
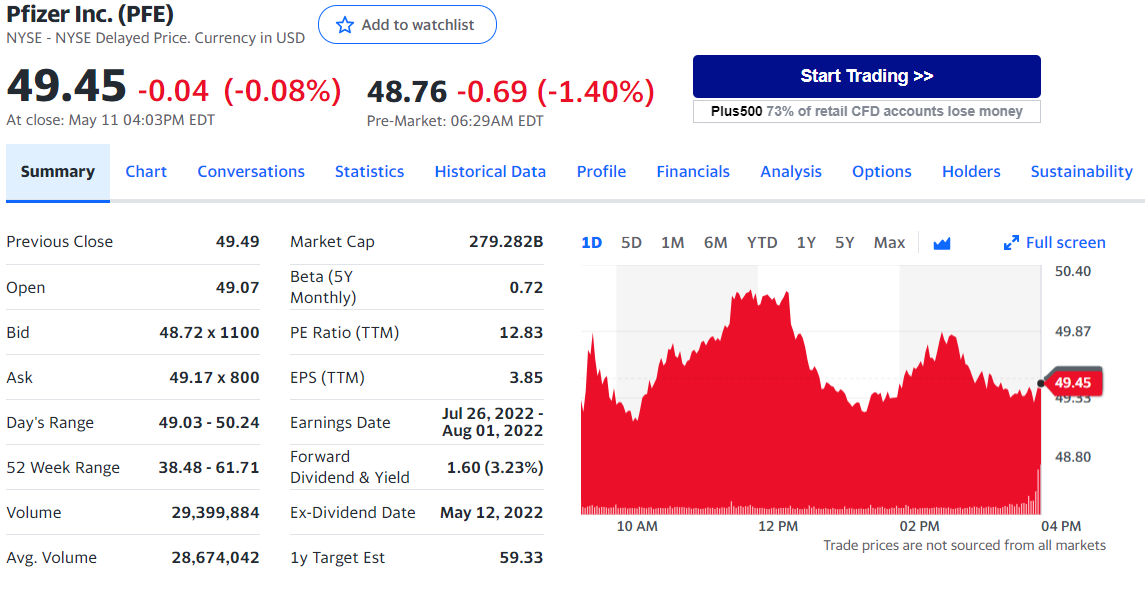
Cash Flow All numbers in thousands Breakdown TTM 12/30/2021 12/30/2020 12/30/2019 12/30/2018 > Operating Cash Flow 32,580,000 14,403,000 12,588,000 15,827,000 > Investing Cash Flow -22,546,000 -4,271,000 -3,945,000 4,525,000 > Financing Cash Flow -9,816,000 -9,649,000 -8,485,000 -20,441,000 > End Cash Position 1,983,000 1,825,000 1,350,000 1,225,000 Income Tax Paid Supplemental Data 7,427,000 3,153,000 3,664,000 3,655,000 Interest Paid Supplemental Data 1,467,000 1,641,000 1,587,000 1,311,000 Capital Expenditure -2,711,000 -2,791,000 -2,594,000 -2,196,000 Issuance of Debt 997,000 17,574,000 21,397,000 8,685,000 Repayment of Debt -2,100,000 -30,329,000 -12,633,000 -9,620,000 Repurchase of Capital Stock 0 -8,865,000 -12,198,000 Free Cash Flow 29,869,000 11,612,000 9,994,000 13,631,000 Pfizer Inc. (PFE) NYSE - NYSE Delayed Price. Currency in USD Add to watchlist 49.45 -0.04 (-0.08%) 48.76 -0.69 (-1.40%) Start Trading >> Plus500 73% of retail CFD accounts lose money At close: May 11 04:03PM EDT Pre-Market: 06:29AM EDT Summary Chart Conversations Statistics Historical Data Profile Financials Analysis Options Holders Sustainability Previous Close 49.49 Market Cap 279.282B 1D 5D 1M 6M YTD 1Y 5Y Max Full screen 50.40 Open 49.07 Beta (5Y Monthly) 0.72 Bid 48.72 x 1100 PE Ratio (TTM) 12.83 49.87 Ask 49.17 x 800 EPS (TTM) 3.85 49.45 49.55 Day's Range 49.03 - 50.24 Earnings Date Jul 26, 2022 - Aug 01, 2022 48.80 52 Week Range 38.48 - 61.71 Forward Dividend & Yield 1.60 (3.23%) Ta Volume 29,399,884 Ex-Dividend Date May 12, 2022 10 AM 12 PM 02 PM 04 PM Trade prices are not sourced from all markets Avg. Volume 28,674,042 1y Target Est 59.33 Cash Flow All numbers in thousands Breakdown TTM 12/30/2021 12/30/2020 12/30/2019 12/30/2018 > Operating Cash Flow 32,580,000 14,403,000 12,588,000 15,827,000 > Investing Cash Flow -22,546,000 -4,271,000 -3,945,000 4,525,000 > Financing Cash Flow -9,816,000 -9,649,000 -8,485,000 -20,441,000 > End Cash Position 1,983,000 1,825,000 1,350,000 1,225,000 Income Tax Paid Supplemental Data 7,427,000 3,153,000 3,664,000 3,655,000 Interest Paid Supplemental Data 1,467,000 1,641,000 1,587,000 1,311,000 Capital Expenditure -2,711,000 -2,791,000 -2,594,000 -2,196,000 Issuance of Debt 997,000 17,574,000 21,397,000 8,685,000 Repayment of Debt -2,100,000 -30,329,000 -12,633,000 -9,620,000 Repurchase of Capital Stock 0 -8,865,000 -12,198,000 Free Cash Flow 29,869,000 11,612,000 9,994,000 13,631,000 Pfizer Inc. (PFE) NYSE - NYSE Delayed Price. Currency in USD Add to watchlist 49.45 -0.04 (-0.08%) 48.76 -0.69 (-1.40%) Start Trading >> Plus500 73% of retail CFD accounts lose money At close: May 11 04:03PM EDT Pre-Market: 06:29AM EDT Summary Chart Conversations Statistics Historical Data Profile Financials Analysis Options Holders Sustainability Previous Close 49.49 Market Cap 279.282B 1D 5D 1M 6M YTD 1Y 5Y Max Full screen 50.40 Open 49.07 Beta (5Y Monthly) 0.72 Bid 48.72 x 1100 PE Ratio (TTM) 12.83 49.87 Ask 49.17 x 800 EPS (TTM) 3.85 49.45 49.55 Day's Range 49.03 - 50.24 Earnings Date Jul 26, 2022 - Aug 01, 2022 48.80 52 Week Range 38.48 - 61.71 Forward Dividend & Yield 1.60 (3.23%) Ta Volume 29,399,884 Ex-Dividend Date May 12, 2022 10 AM 12 PM 02 PM 04 PM Trade prices are not sourced from all markets Avg. Volume 28,674,042 1y Target Est 59.33