Estimate the stocks valuation using the constant growth DDM with a Sustainable growth of 7.2% and a discount rate of 9.6%. Using the information below.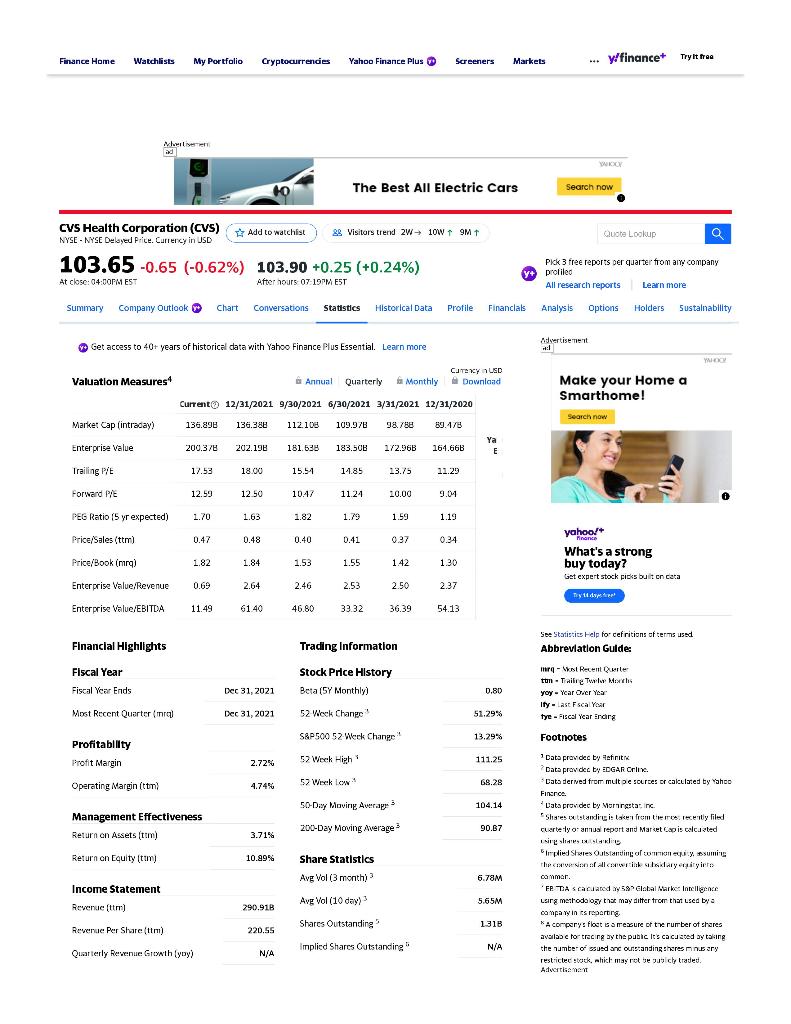
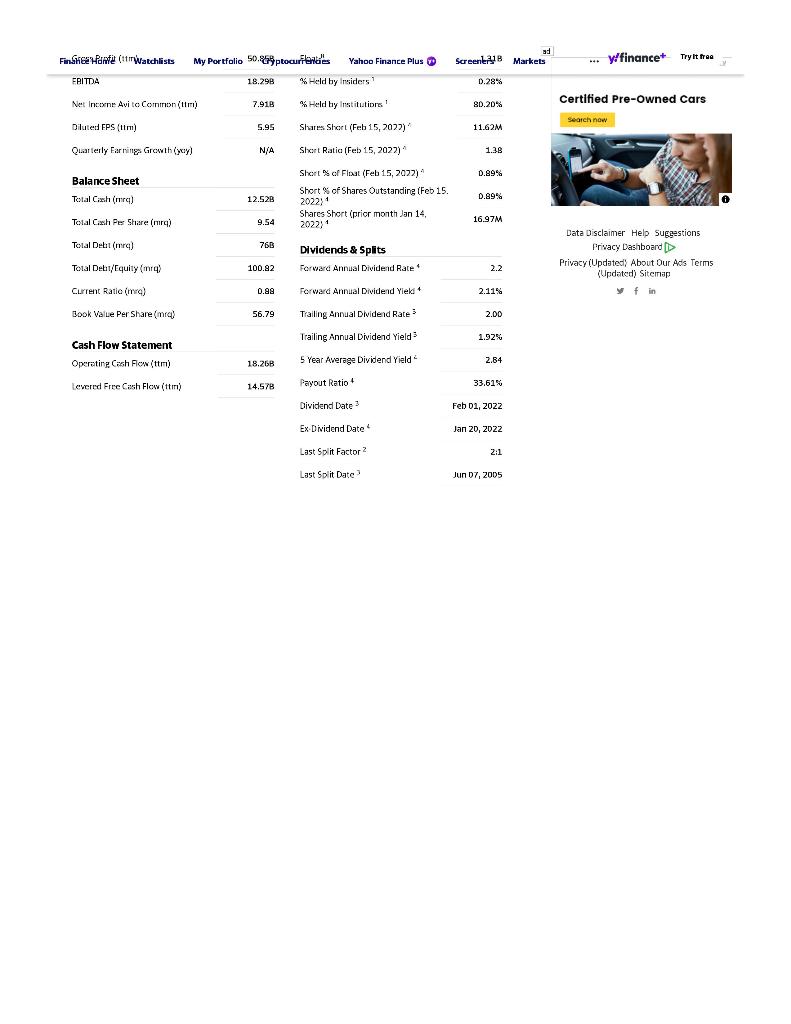
Finance Home Watchlists My Portfolio Cryptocurrencies Yahoo Finance Plus Screeners Markets -. y/finance+ Try it free wherler WOX The Best All Electric Cars Search now CVS Health Corporation (CVS) Add to watchlist ( 89 Visitors trend 2W 10W + 9MT Quote Lookup Q NYSE - NYSE Delayed Price. Currency in USD 103.65 -0.65 (-0.62%) 103.90 +0.25 (+0.24%) Pick 3 free reports per quarter from any company y prolileo All research reports Learn more At close: 04:00PM EST Afterhours 07-19PM EST Summary Company Outlook Chart Conversations Statistics Historical Data Profile Financials Analysis Options Holders Sustainability et access to 40+ years of historical data with Yahoo Finance Plus Essential. Learn more Advertisement : YO Valuation Measures Annual Quarterly CUTEX USD Download Monthly Make your Home a Smarthome! Current 12/31/2021 9/30/2021 6/30/2021 3/31/2021 12/31/2020 Search now Market Cap (intraday) 136.898 136.388 112.108 109.978 98.788 89.178 Enterprise Value 200.37 202.198 161.638 183.500 172.96B 164.668 Ya E Trailing PL 17.53 18.00 15.51 14.85 13.75 11.23 Forward PE 12.59 12.50 10:47 1124 20.00 9.04 PEG Ratio 15 yr expected) 1.70 1.63 1.82 1.79 1.59 1.19 Price/Sales (tm) 0.47 0.48 0.40 0.41 0.37 0.34 Price/Book (ming) 1.82 1.84 1.53 1.55 1.42 1.30 yahoo/ Pinare What's a strong buy today? Get expert stock picks built on cata Tyu de are Enterprise Value Revenue 0.69 2.64 2.46 2.53 2.50 2.37 Enterprise Value/EBITDA / 11.49 6140 46.80 33.32 36.39 54.13 Financial Highlights Trading Information See Statistics Help forcefritions of terms used Abbreviation Guide Fiscal Year Fiscal Year Ends Stock Price History Beta (5Y Monthly) ) Dec 31, 2021 0.80 Ihr - West Recent Quile ton - Taille Twelve Months yoy - Year Over Year Ity as Escal Year tye - Fiscal Year Endre Most Recent Quartermal Dec 31, 2021 52 Week Change 51.29% S&P500 52 Werk Change 13.29% Footnotes 2.72% 52 Week High Profitability Profit margin Operating Margin (tor) tt 111.25 4.74% 52 Week w 68.28 50-Day Moving Averapa 104.14 Management Effectiveness Return on Assets (tm) 200-Day Moving Average 90.67 3.71% Return on Equity (tum 10.99% Share Statistics Data prevdec by nit Data prev dec by EDGAR Crive. Data derved from mult pe sources or calculated by Yahoo Finance Vata prov dec by Morurgstar inc. Share standing is taken from timerecey filed Cuartely of annual report and Market Capis celcasted sir implied Shures Outstanding of tasumine The von Alchwilayeyirtos canmar * Fe Tascacuared y 58Global Market Income Leirg methodology that may differ from that used by a campa win is reporting * A compery: flost carrezure of tx rumber of shares availao cho tracing ay the public Its caused ay taking the number of ssued and outsanding theres n.sary restrictec stock, which may not be as cly traded. Acte Avg Vol (3 month) 6.78M Income Statement Y Avg Vol (10 day) 5.65M Revenuetto) 290.91B Shares Outstanding 1:31B Revenue Per Share (tm) 220.55 implied Shares Outstanding N/A Quarterly Revenue Growth (yoy) N/A Finah Ha (11 frWatchlists My Portfolio 50.4ptocurilendi's Yahoo Finance Plus ad Screentry Markets y/finance+ Try it from ERITA 18.298 Held by Insiders D.28% Net Income Avi to Common(tm) ) 7.91B Held by Institutiores 80.20% Certified Pre-Owned Cars Search now Diluted EPS (tim) 5.95 Shares Short (Feb 15, 2027) 11.62M Quarterly Farmings Growth cy) N/A Short Ratia (Feb 15, 2022) 1.38 0.89% Balance Sheet Total Cach (mra) Short of Float (Feb 15, 2022) Short % of Shares Outstanding (Feb 15 2022) 1 Shares Short (prior month Jan 14, 12.52B 0.89% Total Cash Per Share (m) 9.54 16.97M 20221 Total Dell (ra) 76B Dividends & Splits Data Disclaimer Help Suggestions Privacy Dashboard Privacy (Updated: About Our Ads Terms (Updated) Sitemap yf in 100.82 Forward Annual Dividend Rate 2.2 Total Debit/Equity (mra ) Current Ratio (mm) (wa Book Valle Per Share (mra) ) 0.89 Forward Annual Dividend Yield 2.11% 56.79 Trailing Annual Dividend Rates 2.00 Trailing Annual Dividend Yield 1.92% 18.268 5 Year Average Dividend Yield Cash Flow Statement Operating Cash Flow (tt) ) Levered Free Cash Flow (tm) ) 2.84 14.578 Payout Ratio 33.614 Dividend Date Feb 01, 2022 Ex-Dividend Date 4 Jan 20, 2022 2:1 Last Split Factor 2 Last Split Date Jun 17, 2015