Estimating Share Value using ROPI model
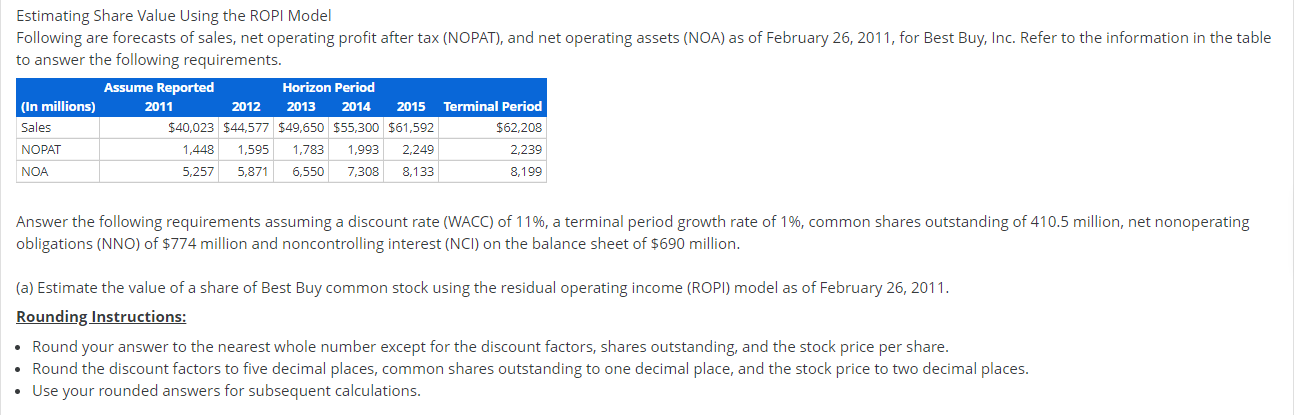
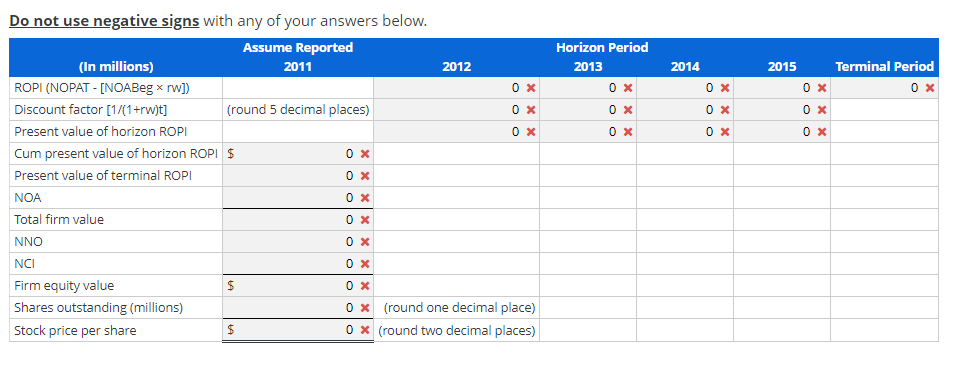
Estimating Share Value Using the ROPI Model Following are forecasts of sales, net operating profit after tax (NOPAT), and net operating assets (NOA) as of February 26, 2011, for Best Buy, Inc. Refer to the information in the table to answer the following requirements. Assume Reported Horizon Period (In millions) 2011 2012 2013 2014 2015 Terminal Period Sales $40,023 $44,577 $49,650 $55,300 $61,592 $62,208 NOPAT 1,448 1,595 1,783 1,993 2,249 2,239 NOA 5.257 5,871 6,550 7,308 8,133 8,199 Answer the following requirements assuming a discount rate (WACC) of 11%, a terminal period growth rate of 1%, common shares outstanding of 410.5 million, net nonoperating obligations (NNO) of $774 million and noncontrolling interest (NCI) on the balance sheet of $690 million. (a) Estimate the value of a share of Best Buy common stock using the residual operating income (ROPI) model as of February 26, 2011. Rounding Instructions: Round your answer to the nearest whole number except for the discount factors, shares outstanding, and the stock price per share. Round the discount factors to five decimal places, common shares outstanding to one decimal place, and the stock price to two decimal places. Use your rounded answers for subsequent calculations. Do not use negative signs with any of your answers below. Terminal Period Horizon Period 2013 OX B 2014 0 x ox 0 x 2015 OX ox 0 x Assume Reported (In millions) 2011 2012 ROPI (NOPAT - [NOABeg x rw]) 0 x Discount factor [1/(1+rw)t] (round 5 decimal places) 0x Present value of horizon ROPI OX Cum present value of horizon ROPI $ Ox Present value of terminal ROPI NOA Total firm value NNO NCI OX Firm equity value Shares outstanding (millions) 0x (round one decimal place) Stock price per share 0 x (round two decimal places) 0 0 0 OX Estimating Share Value Using the ROPI Model Following are forecasts of sales, net operating profit after tax (NOPAT), and net operating assets (NOA) as of February 26, 2011, for Best Buy, Inc. Refer to the information in the table to answer the following requirements. Assume Reported Horizon Period (In millions) 2011 2012 2013 2014 2015 Terminal Period Sales $40,023 $44,577 $49,650 $55,300 $61,592 $62,208 NOPAT 1,448 1,595 1,783 1,993 2,249 2,239 NOA 5.257 5,871 6,550 7,308 8,133 8,199 Answer the following requirements assuming a discount rate (WACC) of 11%, a terminal period growth rate of 1%, common shares outstanding of 410.5 million, net nonoperating obligations (NNO) of $774 million and noncontrolling interest (NCI) on the balance sheet of $690 million. (a) Estimate the value of a share of Best Buy common stock using the residual operating income (ROPI) model as of February 26, 2011. Rounding Instructions: Round your answer to the nearest whole number except for the discount factors, shares outstanding, and the stock price per share. Round the discount factors to five decimal places, common shares outstanding to one decimal place, and the stock price to two decimal places. Use your rounded answers for subsequent calculations. Do not use negative signs with any of your answers below. Terminal Period Horizon Period 2013 OX B 2014 0 x ox 0 x 2015 OX ox 0 x Assume Reported (In millions) 2011 2012 ROPI (NOPAT - [NOABeg x rw]) 0 x Discount factor [1/(1+rw)t] (round 5 decimal places) 0x Present value of horizon ROPI OX Cum present value of horizon ROPI $ Ox Present value of terminal ROPI NOA Total firm value NNO NCI OX Firm equity value Shares outstanding (millions) 0x (round one decimal place) Stock price per share 0 x (round two decimal places) 0 0 0 OX