

Question
estimating the cost of capital Dale: I think the reason we really care about the cost of capital is because we want to know what
estimating the cost of capital
Dale: I think the reason we really care about the cost of capital is because we want to know what hurdle rate Walmart should use for its annual investment in capital projects, which represent billions of dollars each year.
Lee: But I'm not sure if it should make any difference to senior management whether the company is investing in more U.S. stores, remodelling, or investing internationally. Shouldn't they want the same return?
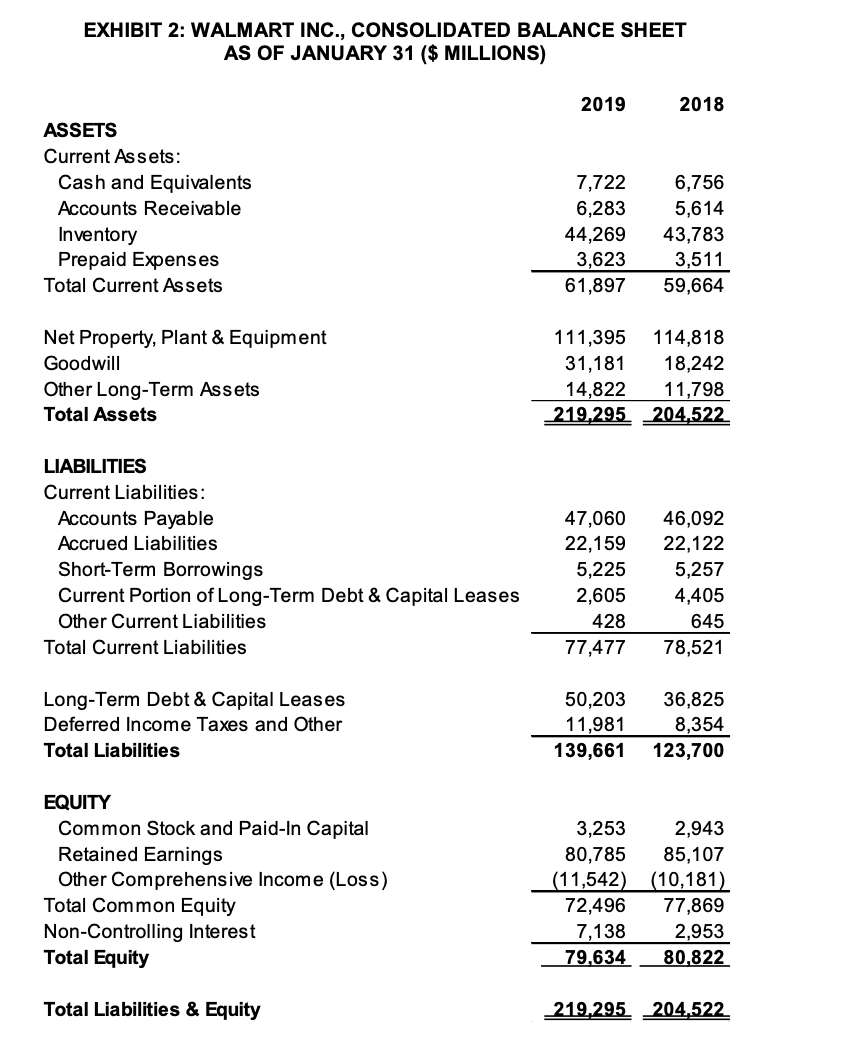
Dale: Interesting question. So, where should we start? I was thinking we might look at the balance sheet-particularly the liabilities and equity section. Shouldn't that show how Walmart financed its assets, which cost over $200 billion?
Lee: Yes, and I think we should try to associate a cost with each of the items. Then we need to figure out how to average them in order to estimate the cost of capital.
Dale: I think we need some kind of interest rate, or borrowing rate, for each of the debt components. Or maybe we can just take a look at how much interest the company paid last year relative to its debt? That might be easier.
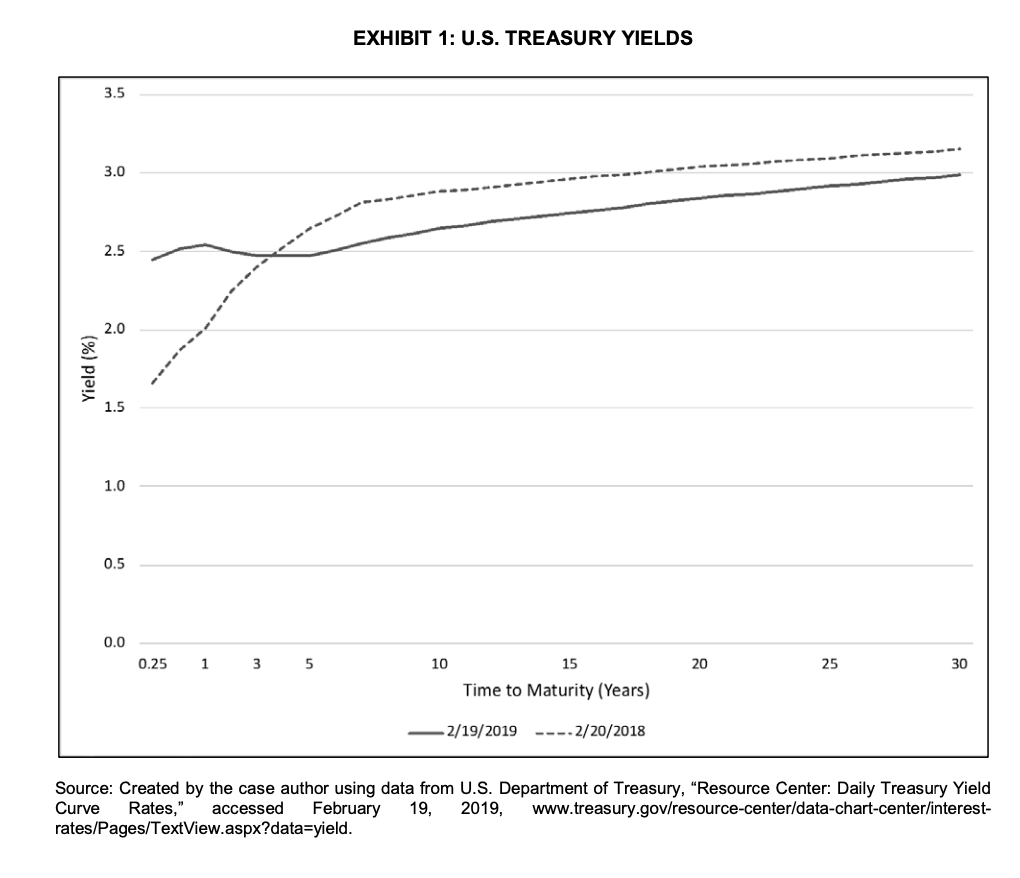
Lee: There sure are a lot of interest rates. I noticed on the U.S. Department of Treasury website that three-month treasury bills were yielding 2.45 per cent, while one-, five-, and 10-year treasury bonds were yielding 2.54 per cent, 2.47 per cent, and 2.65 per cent, respectively. I pulled together those and some other rates to graph today's yield curve compared with last year's. I wonder if we can somehow use this information.
Dale: I found some other interest rates as well. The prime rate is 5.50 per cent, and three-month commercial paper was averaging 2.73 per cent. I read in the annual report that Walmart has issued commercial paper in the past-as part of its short-term borrowing-so perhaps that information might be relevant. I also read that Walmart uses short-term borrowing to provide funds for operations, make capital expenditures, and cover other cash requirements.
Lee: Yes, and I read in the same report that Walmart has issued lots of bonds. Other reports showed the same pattern. For example, I noticed that on February 15, 2000,Walmart issued $1 billion in bonds with a coupon rate of 7.55 per cent. The bonds mature on February 15, 2030, around 11 years from now. I also noticed from an online source that these bonds were selling for $136.38 and yielding 3.53 per cent.I think I need to re-read the background material we were provided with because I'm confused about the difference between coupon rates and yields. Which is more relevant for us?
Dale: What about preferred shares? I don't think Walmart has any currently, but I read that years ago it issued some kind of securities that were like preferred shares. I don't think the company has any plans to issue new preferred shares in the next little while, but maybe we should be prepared to figure out how it should affect the cost of capital if it did.
Lee: How should be go about estimating the cost of equity?
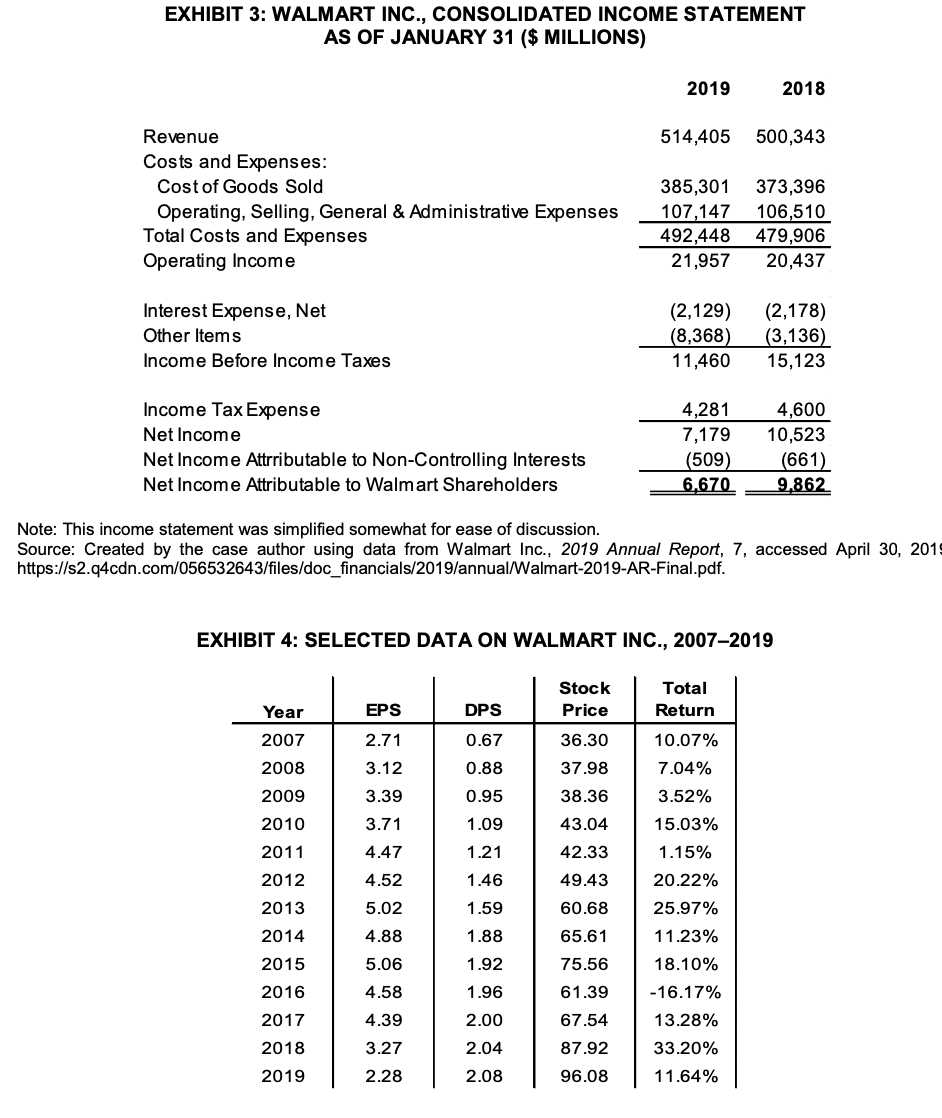
Dale: I think, since shareholder return is in the form of dividends that shareholders receive, we could examine the annual dividends relative to the current stock price. Over the past year, shareholders received $2.08 per share in dividends. The stock was recently trading for $102.20.
Lee: I think earnings are more relevant than dividends. Earnings were down recently because of several one-time write-offs, at the end of the last fiscal year. Walmart recorded $2.26 in unadjusted earnings per share, but $4.91 in adjusted earnings per share. So why not take the earnings yield relative to the stock price?
Dale: I wonder if we can estimate an equity return using accounting information such as the book value of equity. I estimated Walmart's return on equity or ROE to be 8.9 per cents as of the fiscal year ending January 31, 2019. For 2018, 2017 and 2016, it was 12.7, 17.2, and 18.1 per cent, respectively.
Lee: But that includes retained earnings. Aren't those like free capital-and therefore something we can ignore?
Dale: Maybe we're overlooking something; there may be a different approach. Recall that we read about the beta of a stock. It is usually estimated by regressing the return on a stock, like Walmart, against the return on the market, like the S&P 500. According to the Bloomberg terminal we accessed in our library, Walmart's recent "raw" beta was 0.56. it was based on a regression of two years of weekly data.
Lee: I noticed that as well. There was also an "adjusted" beta of 0.71. according to Bloomberg, the ad hoc adjustment-0.67 times the raw beta plus 0.33-always makes the adjusted beta closer to the market's beta of 1.0. this is because of the assumption that a security's beta tends to move toward the market average over time.
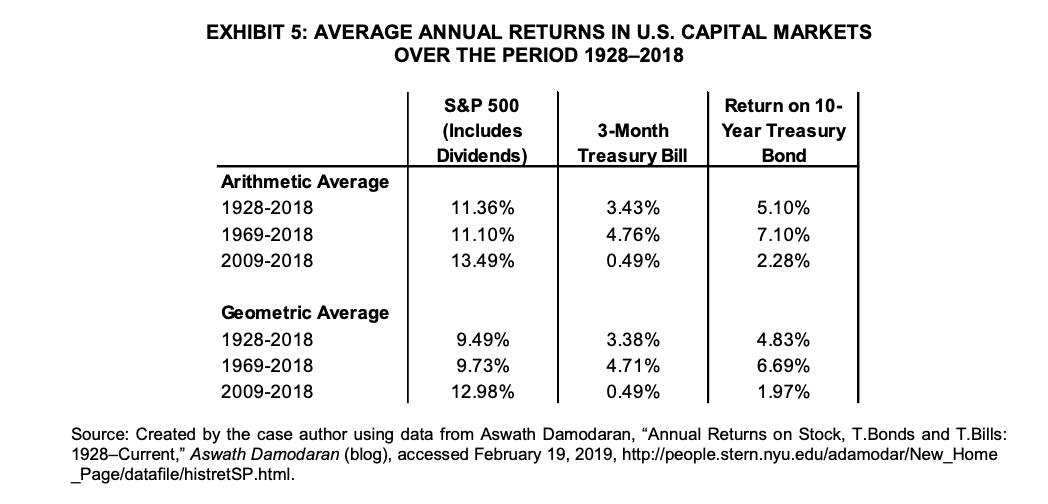
Dale: Well, I think if we try to incorporate Walmart's beta, then we need to somehow take into account overall market returns.
Lee: we also need to incorporate taxes. I'm not sure how we go about doing that. But I also noticed in the business news that corporate tax rates are now lower than in the recent past due to some new U.S. tax regulations. I read that the new rate is 21 per cent. But a recent press released to accompany Walmart's quarterly returns says the company is anticipating an effective tax rate of around 27 per cent.
Dale: what about deferred income taxed? I remember reading that these can arise when a company is allowed to depreciate its assets at a faster rate, for tax purposes, than the actual economic depreciation. Is that money that needs to be paid back to the tax department? If so, what cost is associated with it.
Lee: I'm not sure. I also noticed there are other items on the balance sheet under "Liabilities and Equity," and I'm not even sure what they mean.
Dale: I may have figured them out: "Other Non-Current Liabilities"-which is lumped in with "Deferred Income Taxes" and is probably about half that total-may have to do with some unrealized losses on hedging instruments. "Other Comprehensive Loss" was related to foreign exchange losses, with the U.S. dollar stronger relative to other currencies. And "Non-Controlling Interest" adjusts for subsidiaries that Walmart has a majority stake it. I think we can ignore all of those items.
Lee: It's getting late, and we haven't even talked about how we would estimate the weights for the various sources of capital. I'm wondering if we should just look at the balance sheet for clues. Or maybe there's another way.
Dale: I'm not sure if it even makes sense to take an average. Shouldn't we just look at the next source of financing? For example, if Walmart borrows or issues bonds just before taking on its next major project, then shouldn't we just take the cost associated with that?
Lee: Well, I think we've now come full circle. Once we estimate the cost of capital, how do we determine what hurdle rate we should use for projects? And how should Walmart decide which projects to accept: using the next present value approach or the internal rate of return method?
Dale: I don't think it matters. But I do think we need to try to put this all together soon so that we get a final number and explain how we arrived at it.
Step by Step Solution
There are 3 Steps involved in it
Step: 1

Get Instant Access to Expert-Tailored Solutions
See step-by-step solutions with expert insights and AI powered tools for academic success
Step: 2

Step: 3
Ace Your Homework with AI
Get the answers you need in no time with our AI-driven, step-by-step assistance
Get Started
Management Fundamentals
Authors: Robert N. Lussier
1st Edition
032401337X, 978-0324013375