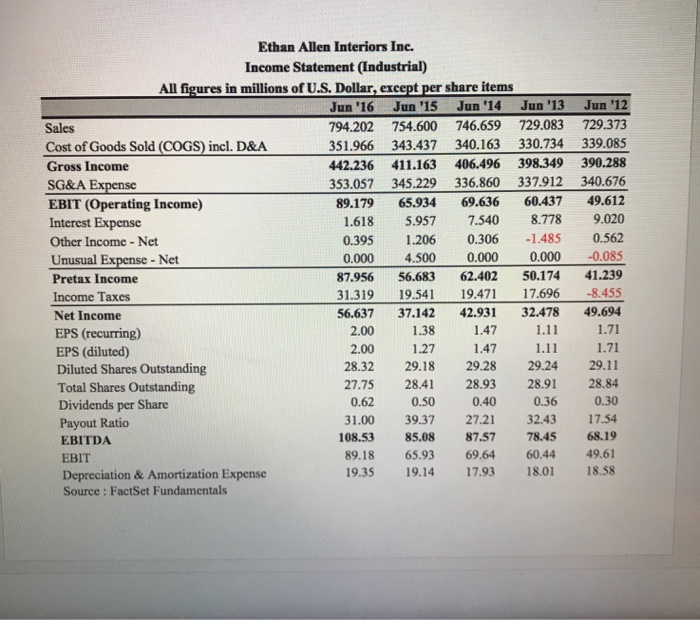
Ethan Allen Interiors Inc. Income Statement (Industrial) All figures in millions of U.S. Dollar, except per share items Jun '16Jun 15 Jun '14 Jun '13 Jun '12 794.202 754.600 746.659 729.083 729.373 351.966 343.437 340.163 330.734 339.085 442.236 411.163 406.496 398.349 390.288 353.057 345.229 336.860 337.912 340.676 89.179 65.934 69.636 60.437 49.612 1.618 5.957 7.540 8.778 9.020 0.395 1.206 0.306-1.485 0.562 0.000 4.500 0.000 0.0000.085 87.956 56.683 62.402 50.174 41.239 31.319 19.541 19.471 17.696 -8.455 56.637 37.142 42.931 32.478 49.694 2.00 138 147 1.71 2.00 1.27 1.47 1.11 1.71 28.32 29.18 29.28 29.24 29.11 27.75 28.41 28.93 28.91 28.84 0.62 0.500.40 0.36 0.30 31.00 39.3727.21 32.43 17.54 108.53 85.08 87.57 78.45 68.19 89.18 65.9369.64 60.44 49.61 19.35 19.14 17.93 18.01 18.58 Sales Cost of Goods Sold (COGS) incl. D&A Gross Income 0 SG&A Expense EBIT (Operating Income Interest Expense Other Income-Net Unusual Expense - Net Pretax Income Income Taxes Net Income EPS (recurring) EPS (diluted) Diluted Shares Outstanding 2 2 Total Shares Outstanding Dividends per Share Payout Ratio EBITDA EBIT Depreciation & Amortization Expense Source : FactSet Fundamentals Ethan Allen Interiors Inc. Income Statement (Industrial) All figures in millions of U.S. Dollar, except per share items Jun '16Jun 15 Jun '14 Jun '13 Jun '12 794.202 754.600 746.659 729.083 729.373 351.966 343.437 340.163 330.734 339.085 442.236 411.163 406.496 398.349 390.288 353.057 345.229 336.860 337.912 340.676 89.179 65.934 69.636 60.437 49.612 1.618 5.957 7.540 8.778 9.020 0.395 1.206 0.306-1.485 0.562 0.000 4.500 0.000 0.0000.085 87.956 56.683 62.402 50.174 41.239 31.319 19.541 19.471 17.696 -8.455 56.637 37.142 42.931 32.478 49.694 2.00 138 147 1.71 2.00 1.27 1.47 1.11 1.71 28.32 29.18 29.28 29.24 29.11 27.75 28.41 28.93 28.91 28.84 0.62 0.500.40 0.36 0.30 31.00 39.3727.21 32.43 17.54 108.53 85.08 87.57 78.45 68.19 89.18 65.9369.64 60.44 49.61 19.35 19.14 17.93 18.01 18.58 Sales Cost of Goods Sold (COGS) incl. D&A Gross Income 0 SG&A Expense EBIT (Operating Income Interest Expense Other Income-Net Unusual Expense - Net Pretax Income Income Taxes Net Income EPS (recurring) EPS (diluted) Diluted Shares Outstanding 2 2 Total Shares Outstanding Dividends per Share Payout Ratio EBITDA EBIT Depreciation & Amortization Expense Source : FactSet Fundamentals


