

Question
Etsy versus Amazon in the Market for Artisan Goods In this subject, you will learn to compute and interpret common financial ratios derived from categories
Etsy versus Amazon in the Market for Artisan Goods
In this subject, you will learn to compute and interpret common financial ratios derived from categories of financial information that are components of a firms basic financial statements. This examines how these ratios are used to better understand the determinants of a firms profitability. In this discussion, you are asked to analyze basic financial statements and other key financial metrics of Etsy (ETSY), the firm which was introduced in our Module One Discussion Activity, and Amazon, a massive online retailer. You may wish to begin by reviewing the Management Discussion and Analysis (MD&A) which is found in Amazons recent SEC filing (Amazon, 2016). Differences in managerial decisions that are evidenced within these firms financial statements, including the use of leverage, will be the subject of this discussion. To summarize some difference between the firms, Etsy maintains an online platform which allows artisans from around the globe to distribute their goods. Etsys revenue consists of the 3.5% fee that an Etsy seller pays for each completed transaction on its platform. Etsys cost of revenue consists primarily of expenses associated with the operation and maintenance of our platform and data centers. Operating expenses additionally consist of marketing, product development and general and administrative expenses. Toward the end of 2014, Etsy began to increasing its brand and digital marketing efforts, which involved business changes and reorganizations that moved certain teams previously focused on product-related projects into marketing. Gross merchandise sales, or GMS, is the dollar value of items sold in Etsys marketplace within the applicable period. Etsys GMS were $2.4 billion in 2015, up 23.6% over 2014, and $1.9 billion in 2014, up 43.3% over 2013. Etsy is not as diversified as Amazon, however, nor does it hold physical inventories, as Amazon does. Etsy operates a marketplace which connects sellers and buyers of unique goods. As of December 31, 2015, it connected a community of 1.6 million active Etsy sellers and 24.0 million active Etsy buyers, in nearly every country in the world. Nevertheless, Etsy incurred net losses of $54.1 million, $15.2 million, and $0.8 million for the years ended December 31, 2015, 2014 and 2013, respectively. While it has incurred losses, these decreased over time. Etsy has never declared or paid cash dividends on its capital stock. It states that it intends to retain all available funds and any future earnings and does not anticipate paying any cash dividends in the foreseeable future. In 2015, Etsy generated revenue of $273.5 million, up 39.8% over 2014, and in 2014, it generated revenue of $195.6 million, up 56.4% over 2013 (Etsy, 2016). In contrast, the products offered on Amazons consumer-facing websites primarily include merchandise and content it purchased for resale from vendors and those offered by third-party sellers; it also manufactures and sells electronic devices. It also offers other services such as computing, storage, and database offerings, fulfillment, publishing, digital content subscriptions, advertising, and co-branded credit cards. Amazon's sales increased 20%, 20%, and 22% in 2015, 2014, and 2013, compared to the comparable prior year periods (Amazon, 2016). Amazon has recently announced intentions to expand into the area of handmade-goods, such as those sold by Etsy.
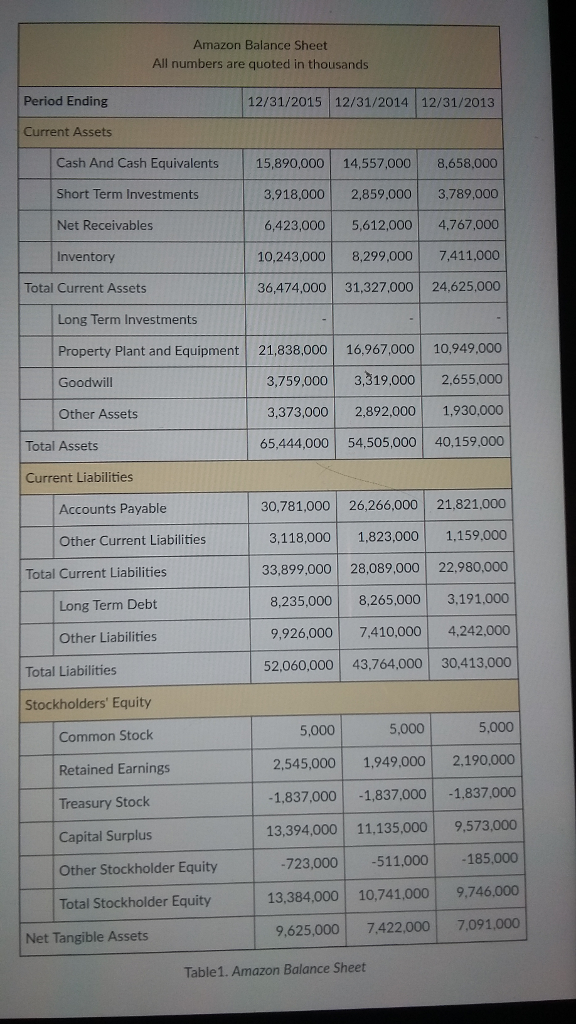
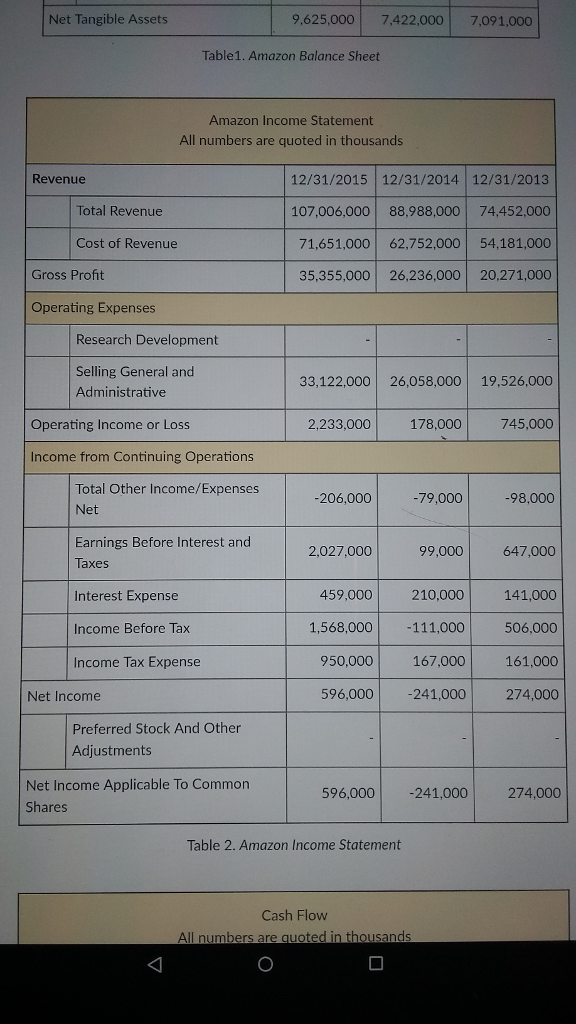
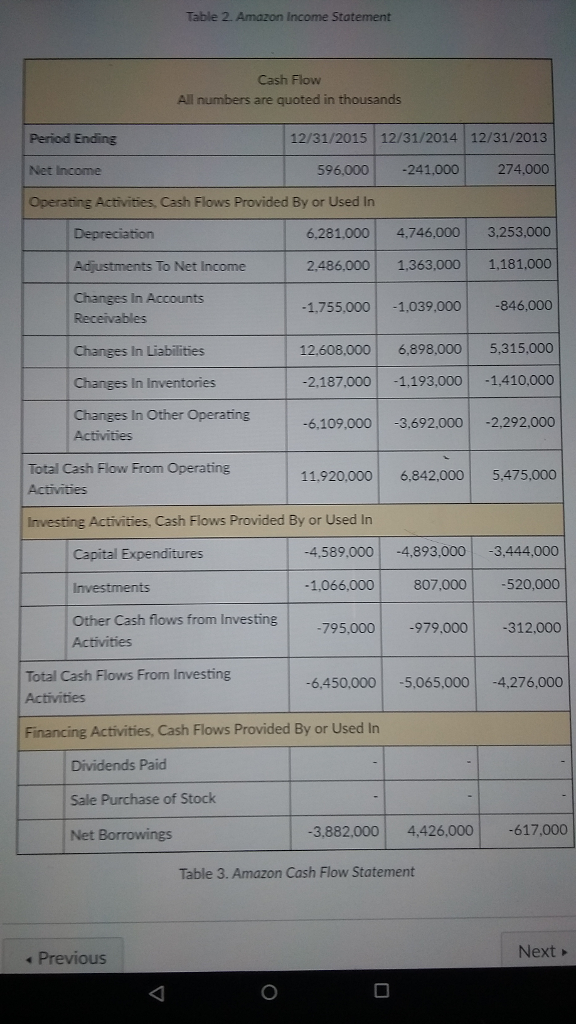
Use Tables 1 through 3.
Assume that you have been hired as an operational risk manager by Etsy, an online retailer of craft goods. You are meeting with a management team to discuss operational strategy, and you are invited to present an analysis of the recent management and operations at both Etsy, and Amazon (Motley Fool, n.d.) as a competitor, comparing the two firms relative financial strategies. (Bensinger, 2015). For purposes of this comparison, you will refer back to the financial statements of Etsy, which were included in the previous (Module One) discussion. Amazons financial statements are supplied here. Assume that the group that you are speaking to includes design specialists that are not trained in financial principles.
Tasks
To ascertain whether Amazon is an appropriate aspirational peer for Etsy in that it provides a positive financial role model, evaluate trends in both Etsy and Amazons financial performance, using peer group analysis and ratio analysis to evaluate these firms relative performance in the following three areas:
ASSET MANAGEMENT
PROFITABILITY
USE OF LEVERAGE
NOTES:
Its important for a financial analyst to analyze various financial ratios. Its important for a companys profitability to increase over time. Both the basic earning power (BEP) ratio and the return on assets (ROA) ratio are important measures of a companys profitability. Both have total assets in the denominator. The difference is with the numerator. ROA ratio uses net income available to common stockholders in the numerator, whereas the BEP ratio uses earnings before interest and taxes (EBIT). Thus, without taking into account a firms taxes and interest expense (capital structure decision through debt selection), the BEP ratio provides a return measurement.
It is useful for a financial analyst to analyze various financial ratios. There are many profitability ratios to choose from such as the profit margin on sales, the basic earning power ratio, the return on total assets (ROA), and return on common equity (ROE). There are many management efficiency ratios to choose from such as the inventory turnover ratio, the days sales outstanding ratio, the fixed assets turnover ratio, and the total assets turnover ratio. There are many leverage ratios to choose from such as the total debt to total assets ratio, the times-interest-earned ratio, and the EBITDA coverage ratio. Regarding other types of ratios, there are various liquidity and market value ratios to choose. For liquidity ratios, theres the current ratio and the quick ratio. For market value ratios, there is the price/earnings ratio, the price/cash flow ratio, and the market/book ratio.
OUTCOME:
Evaluate a firm's use of leverage using financial statement analysis.
Evaluate the financial position of the firm using time and trend or peer-group analysis.
Step by Step Solution
There are 3 Steps involved in it
Step: 1

Get Instant Access to Expert-Tailored Solutions
See step-by-step solutions with expert insights and AI powered tools for academic success
Step: 2

Step: 3
Ace Your Homework with AI
Get the answers you need in no time with our AI-driven, step-by-step assistance
Get Started
The Price Of Global Health Drug Pricing Strategies To Balance Patient Access And The Funding Of Innovation
Authors: Ed Schoonveld
2nd Edition
1472438809,1472438825