Answered step by step
Verified Expert Solution
Question
1 Approved Answer
Evaluate the company's performance in terms of: 1. Liquidity (10 points) 2. Profitability (10 points) 3. Long-term Solvency (10 points) 4. Adequacy of cash


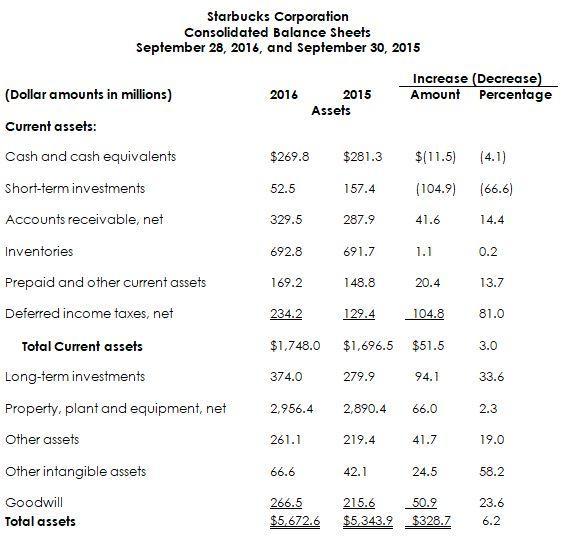
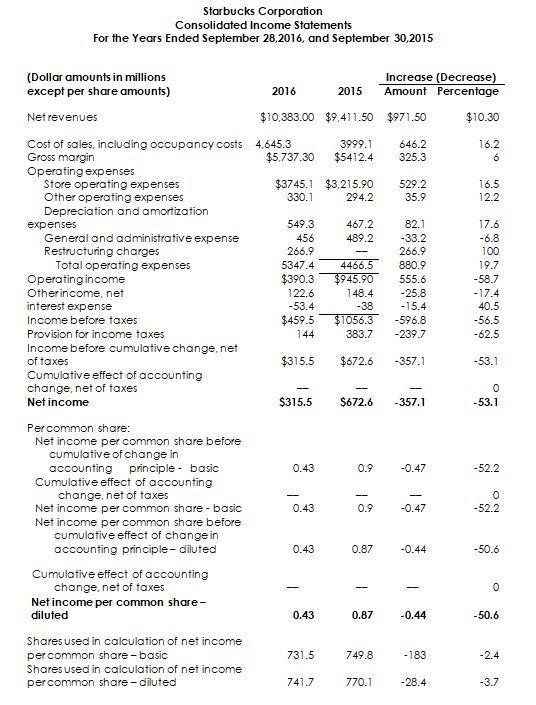
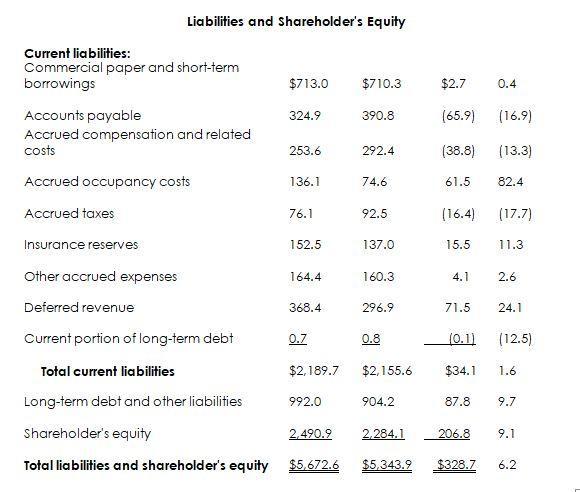
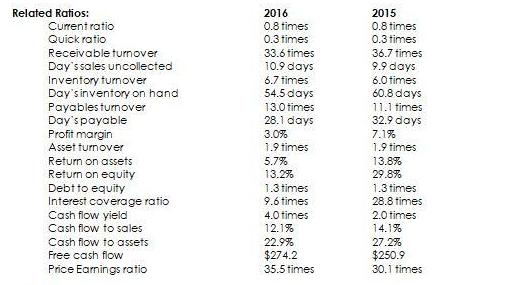
Evaluate the company's performance in terms of: 1. Liquidity (10 points) 2. Profitability (10 points) 3. Long-term Solvency (10 points) 4. Adequacy of cash flows (10 points) 5. Market strength (10 points) Starbucks Corporation Consolidated Balance Sheets September 28, 2016, and September 30, 2015 (Dollar amounts in millions) Current assets: Cash and cash equivalents Short-term investments Accounts receivable, net Inventories Prepaid and other current assets Deferred income taxes, net Total Current assets Long-term investments Property, plant and equipment, net Other assets Other intangible assets Goodwill Total assets 2016 $269.8 52.5 329.5 692.8 169.2 234.2 $1,748.0 374.0 2,956.4 261.1 Assets 66.6 2015 $281.3 157.4 287.9 691.7 148.8 129.4 279.9 2,890.4 219.4 Increase (Decrease) Amount Percentage 42.1 $(11.5) (4.1) (104.9) (66.6) 41.6 $1,696.5 $51.5 1.1 20.4 104.8 94.1 66.0 41.7 24.5 266.5 215.6 50.9 $5,672.6 $5,343.9 $328.7 14.4 0.2 13.7 81.0 3.0 33.6 2.3 19.0 58.2 23.6 6.2 Starbucks Corporation Consolidated Income Statements For the Years Ended September 28,2016, and September 30,2015 (Dollar amounts in millions except per share amounts) Net revenues Cost of sales, including occupancy costs 4,645.3 Gross margin Operating expenses Store operating expenses Other operating expenses Depreciation and amortization expenses General and administrative expense Restructuring charges Total operating expenses Operating income Other income.net interest expense Income before taxes Provision for income taxes Income before cumulative change, net of taxes Cumulative effect of accounting change, net of taxes Net income Per common share: Net income per common share before cumulative of change in accounting principle- basic Cumulative effect of accounting change, net of taxes Net income per common share - basic Net income per common share before cumulative effect of change in accounting principle-diluted Cumulative effect of accounting change, net of taxes Net income per common share- diluted Shares used in calculation of net income per common share-basic Shares used in calculation of net income per common share-diluted 2016 $10,383.00 $9.411.50 $971.50 3999.1 646.2 $5,737.30 $5412.4 325.3 $3745.1 $3,215.90 330.1 294.2 549.3 456 266.9 5347.4 $390.3 122.6 -53.4 $459.5 144 $315.5 $315.5 0.43 0.43 0.43 1 Increase (Decrease) 2015 Amount Percentage 0.43 731.5 741.7 467.2 489.2 - 4466.5 $945.90 148.4 -38 $1056.3 383.7 $672.6 0.9 $672.6 -357.1 0.9 0.87 -- 0.87 529.2 35.9 749.8 770.1 82.1 -33.2 266.9 880.9 555.6 -25.8 -15.4 -596.8 -239.7 -357.1 -0.47 - -0.47 -0.44 - -0.44 -183 -28.4 $10.30 16.2 6 16.5 12.2 17.6 -6.8 100 19.7 -58.7 -17.4 40.5 -56.5 -62.5 -53.1 0 -53.1 -52.2 0 -52.2 -50.6 0 -50.6 -2.4 -3.7 Liabilities and Shareholder's Equity Current liabilities: Commercial paper and short-term borrowings Accounts payable Accrued compensation and related costs Accrued occupancy costs Accrued taxes Insurance reserves Other accrued expenses Deferred revenue Current portion of long-term debt Total current liabilities Long-term debt and other liabilities Shareholder's equity Total liabilities and shareholder's equity $713.0 $710.3 324.9 253.6 136.1 76.1 152.5 164.4 368.4 0.7 $2,189.7 992.0 2,490.9 $5,672.6 390.8 292.4 74.6 92.5 137.0 160.3 296.9 0.8 $2,155.6 904.2 $2.7 0.4 (65.9) 2.284.1 (38.8) 61.5 (16.4) 15.5 4.1 71.5 (0.1) $34.1 87.8 (16.9) (13.3) 82.4 (17.7) 11.3 2.6 24.1 (12.5) 1.6 9.7 206.8 $5,343.9 $328.7 6.2 9.1 Related Ratios: Currentratio Quick ratio Receivable turnover Day's sales uncollected Inventory turnover Day's inventory on hand Payables turnover Day's payable Profit margin Asset turnover Return on assets Return on equity Debt to equity Interest coverage ratio Cash flow yield Cash flow to sales Cash flow to assets Free cash flow Price Earnings ratio 2016 0.8 times 0.3 times 33.6 times 10.9 days 6.7 times 54.5 days 13.0 times 28.1 days 3.0% 1.9 times 5.7% 13.2% 1.3 times 9.6 times 4.0 times 12.1% 22.9% $274.2 35.5 times 2015 0.8 times 0.3 times 36.7 times 9.9 days 6.0 times 60.8 days 11.1 times 32.9 days 7.1% 1.9 times 13.8% 29.8% 1.3 times 28.8 times 2.0 times 14.1% 27.2% $250.9 30.1 times
Step by Step Solution
★★★★★
3.44 Rating (151 Votes )
There are 3 Steps involved in it
Step: 1
Current ratlo and Quick ratlo are measure of short term liquidity Current ratio measures the companys ability to pay off its llabilities due In 1 year with its current assets Similarly the quick ratlo measures a companys ability to meet its shortterm llabilities with its liquid assets Higher the value of current and quick ratlo higher will be the liquidity of the company ...
Get Instant Access to Expert-Tailored Solutions
See step-by-step solutions with expert insights and AI powered tools for academic success
Step: 2

Step: 3

Ace Your Homework with AI
Get the answers you need in no time with our AI-driven, step-by-step assistance
Get Started


