

Question
Evaluate the financial performance and growth prospects of Talaat Mostafa Group. Using the selected financial ratios provided, analyze these key financial metrics to write a
Evaluate the financial performance and growth prospects of Talaat Mostafa Group. Using the selected financial ratios provided, analyze these key financial metrics to write a report about the financial health of the group that should be submitted to the board of directors.
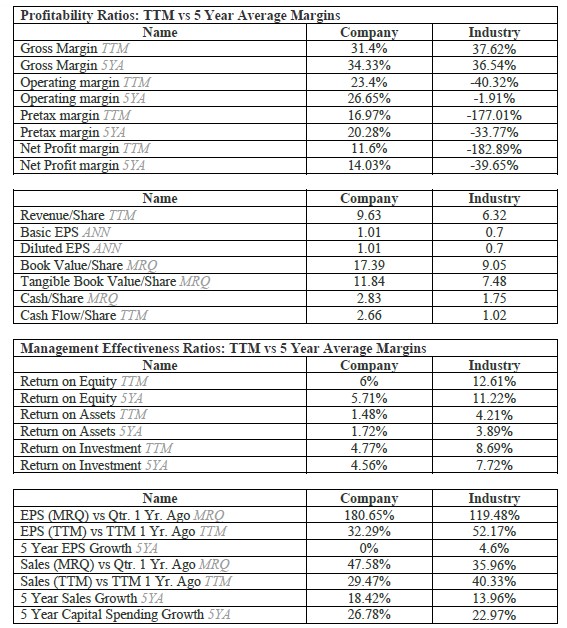
\begin{tabular}{|l|c|c|} \hline \multicolumn{3}{|l|}{ Profitability Ratios: TTM vs 5 Year Average Margins } \\ \hline \multicolumn{1}{|c|}{ Name } & Company & Industry \\ \hline Gross Margin TTM & 31.4% & 37.62% \\ \hline Gross Margin 5YA & 34.33% & 36.54% \\ \hline Operating margin TTM & 23.4% & 40.32% \\ \hline Operating margin 5YA & 26.65% & 1.91% \\ \hline Pretax margin TTM & 16.97% & 177.01% \\ \hline Pretax margin 5YA & 20.28% & 33.77% \\ \hline Net Profit margin TTM & 11.6% & 182.89% \\ \hline Net Profit margin 5YA & 14.03% & 39.65% \\ \hline \end{tabular} \begin{tabular}{|l|c|c|} \hline \multicolumn{1}{|c|}{ Name } & Company & Industry \\ \hline Revenue/Share TTM & 9.63 & 6.32 \\ \hline Basic EPS ANN & 1.01 & 0.7 \\ \hline Diluted EPS ANN & 1.01 & 0.7 \\ \hline Book Value/Share MRQ & 17.39 & 9.05 \\ \hline Tangible Book Value/Share MRQ & 11.84 & 7.48 \\ \hline Cash/Share MRQ & 2.83 & 1.75 \\ \hline Cash Flow/Share TTM & 2.66 & 1.02 \\ \hline \end{tabular} \begin{tabular}{|l|c|c|} \hline \multicolumn{3}{|c|}{ Management Effectiveness Ratios: TTM vs 5 Year Average Margins } \\ \hline \multicolumn{1}{|c|}{ Name } & Company & Industry \\ \hline Return on Equity TTM & 6% & 12.61% \\ \hline Return on Equity 5YA & 5.71% & 11.22% \\ \hline Return on Assets TTM & 1.48% & 4.21% \\ \hline Return on Assets 5YA & 1.72% & 3.89% \\ \hline Return on Investment TTM & 4.77% & 8.69% \\ \hline Return on Investment 5YA & 4.56% & 7.72% \\ \hline \end{tabular} \begin{tabular}{|l|c|c|} \hline \multicolumn{1}{|c|}{ Name } & Company & Industry \\ \hline EPS (MRQ) vs Qtr. 1 Yr. Ago MRO & 180.65% & 119.48% \\ \hline EPS (TTM) vs TTM 1 Yr. Ago TTM & 32.29% & 52.17% \\ \hline 5 Year EPS Growth 5YA & 0% & 4.6% \\ \hline Sales (MRQ) vs Qtr. 1 Yr. Ago MRQ & 47.58% & 35.96% \\ \hline Sales (TTM) vs TTM 1 Yr. Ago TTM & 29.47% & 40.33% \\ \hline 5 Year Sales Growth 5YA & 18.42% & 13.96% \\ \hline 5 Year Capital Spending Growth 5YA & 26.78% & 22.97% \\ \hline \end{tabular}
Step by Step Solution
There are 3 Steps involved in it
Step: 1

Get Instant Access to Expert-Tailored Solutions
See step-by-step solutions with expert insights and AI powered tools for academic success
Step: 2

Step: 3
Ace Your Homework with AI
Get the answers you need in no time with our AI-driven, step-by-step assistance
Get Started
Financial Markets and Institutions
Authors: Anthony Saunders, Marcia Cornett
6th edition
9780077641849, 77861663, 77641841, 978-0077861667