Evaluate the performance of company X, as per the shared company X financials
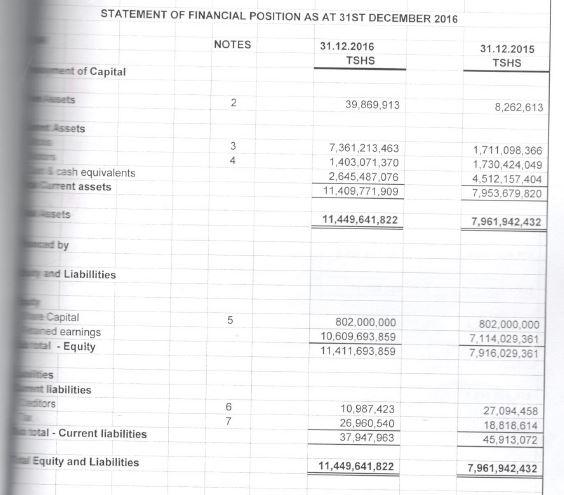
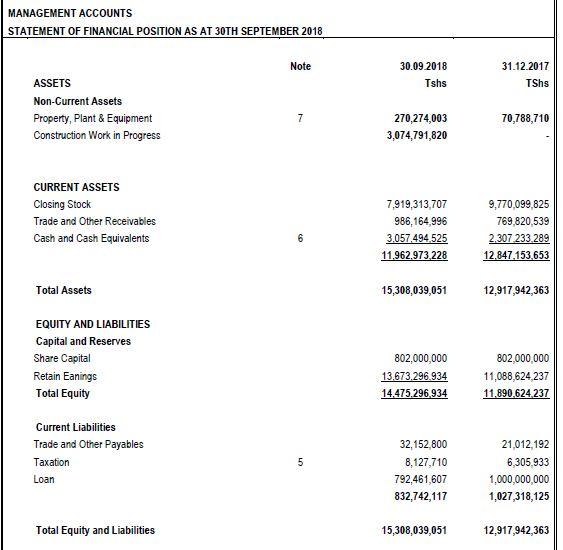
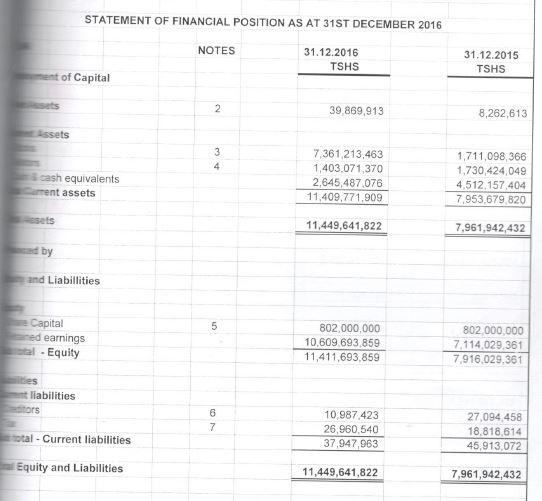
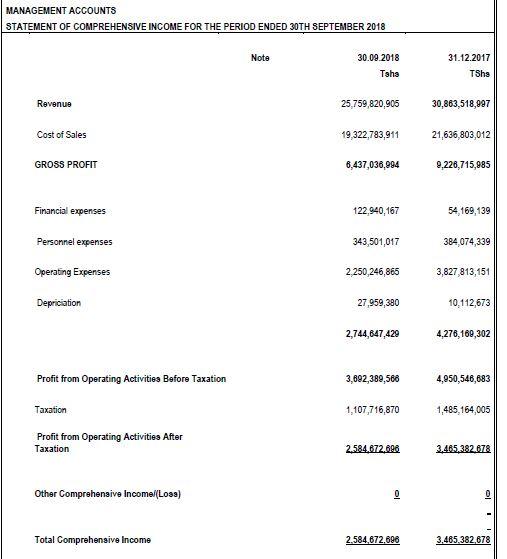
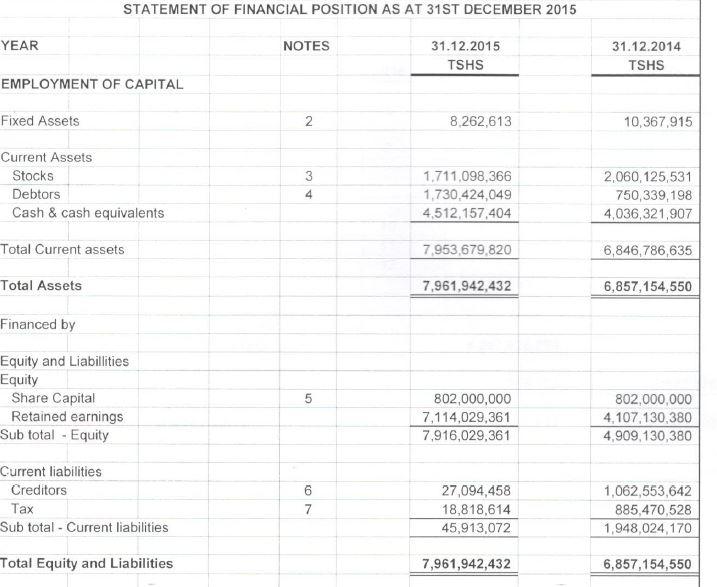
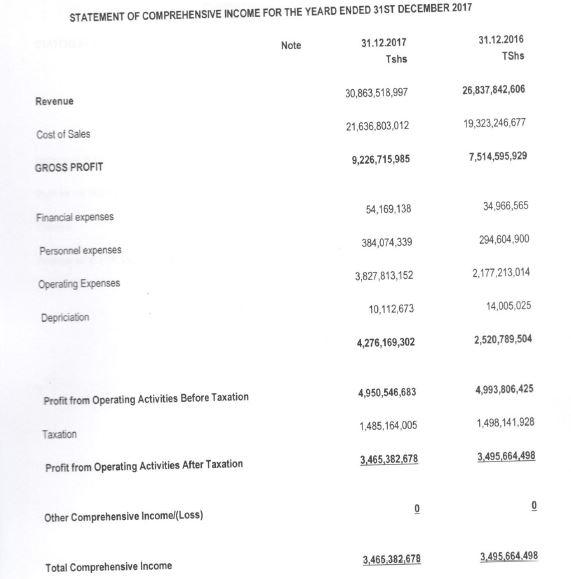
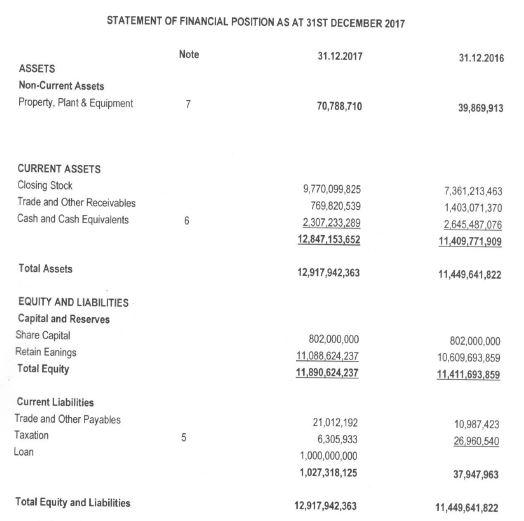
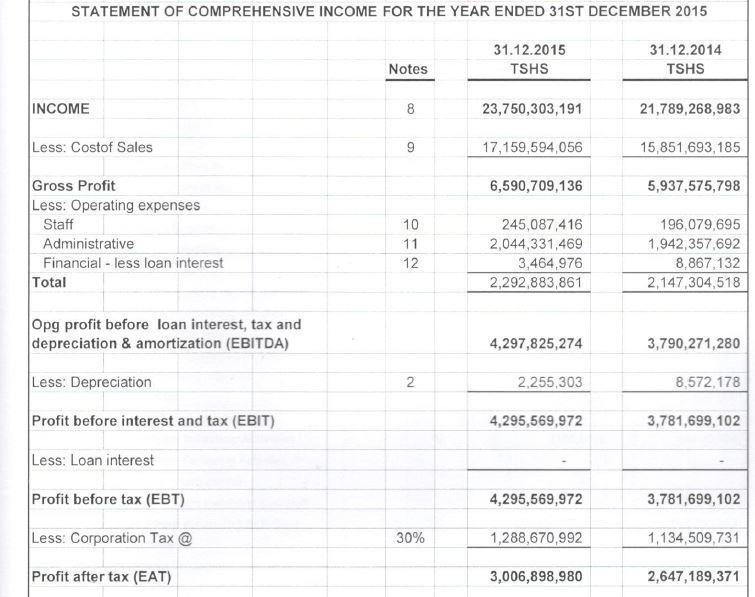
STATEMENT OF FINANCIAL POSITION AS AT 31ST DECEMBER 2016 NOTES 31.12.2016 TSHS ent of Capital 31.12.2015 TSHS 2 39 869,913 8,262,613 Assets 3 4 cash equivalents Current assets 7,361,213,463 1,403.071,370 2,645,487 076 11.409,771,909 1.711,098,366 1,730,424,049 4,512.157,404 7.953,679.820 sets 11,449,641,822 7,961,942,432 and by and Liabillities 5 Capital red earnings - Equity 802,000,000 10,609 693.859 11,411,693.859 802.000.000 7,114,029,361 7,916,029,361 bes liabilities stors 6 7 10.987.423 26,960,540 37,947,963 27,094 458 18.818.614 45,913,072 Total - Current liabilities Equity and Liabilities 11,449,641,822 7,961,942,432 MANAGEMENT ACCOUNTS STATEMENT OF FINANCIAL POSITION AS AT 30TH SEPTEMBER 2018 Note 30.09.2018 Tshs 31.12.2017 TShs ASSETS Non-Current Assets Property, Plant & Equipment Construction Work in Progress 7 70,788,710 270,274,003 3,074,791,820 CURRENT ASSETS Closing Stock Trade and Other Receivables Cash and Cash Equivalents 7,919,313,707 986,164,996 3.057.494525 11.962,973,228 9,770,099,825 769.820.539 2.307.233.289 12.847,153,653 6 15,308,039,051 12,917,942,363 Total Assets EQUITY AND LIABILITIES Capital and Reserves Share Capital Retain Eanings Total Equity 802,000,000 13.673.296.934 14,475,296,934 802,000,000 11,088,624,237 11.890.624,237 Current Liabilities Trade and Other Payables Taxation Loan 5 32,152,800 8,127,710 792,461,607 832,742,117 21.012.192 6,305,933 1,000,000,000 1,027,318,125 Total Equity and Liabilities 15,308,039,051 12,917,942,363 STATEMENT OF FINANCIAL POSITION AS AT 31ST DECEMBER 2016 NOTES 31.12.2016 TSHS 31.12.2015 TSHS ment of Capital sats 2 39.869,913 8,262,613 assets 3 A cash equivalents arent assets 7,361 213,463 1,403.071,370 2,645,487,076 11,409,771,909 1,711,098,366 1,730,424,049 4.512.157,404 7,953,679 820 11,449,641,822 7,961,942,432 ed by and Liabilities 5 Capital med earnings - Equity 802,000,000 10.609.693,859 11,411,693,859 802.000.000 7,114,029,361 7,916.029,361 liabilities sitors 6 7 10 987.423 26,960,540 37,947,963 27,094.458 18.818,614 45,913,072 total - Current liabilities Equity and Liabilities 11,449,641,822 7,961,942,432 MANAGEMENT ACCOUNTS STATEMENT OF COMPREHENSIVE INCOME FOR THE PERIOD ENDED 30TH SEPTEMBER 2018 Note 30.09.2018 Taha 31.12.2017 TShs Revenue 25.759,820,905 30,863,518,997 Cost of Sales 19,322,783,911 21,636 803,012 GROSS PROFIT 6,437,036,994 2,228,715,985 Financial expenses 122.940,167 54,169,139 Personnel expenses 343,501,017 384,074,339 Operating Expenses 2,250,246,865 3,827 813,151 Depriciation 27,959,380 10,112,673 2,744,847,429 4,276,169,302 Profit from Operating Activities Before Taxation 3,892,389,566 4,950,546,683 Taxation 1,107,716,870 1,485,164,005 Profit from Operating Activities After Taxation 2.584.672.696 3.465,382.678 Other Comprehensive Incomel(Loss) 0 OLI Total Comprehensive Income 2.584,672.696 3,465,382.678 STATEMENT OF FINANCIAL POSITION AS AT 31ST DECEMBER 2015 YEAR NOTES 31.12.2015 TSHS 31.12.2014 TSHS EMPLOYMENT OF CAPITAL Fixed Assets 2 8,262,613 10,367,915 Current Assets Stocks Debtors Cash & cash equivalents 3 4 1.711,098,366 1,730,424,049 4,512,157,404 2,060,125,531 750,339,198 4,036,321,907 Total Current assets 7,953,679.820 6,846,786,635 Total Assets 7,961,942,432 6,857,154,550 Financed by Equity and Liabillities Equity Share Capital Retained earnings Sub total - Equity 6 802,000,000 7,114,029,361 7,916,029,361 802,000,000 4,107,130,380 4,909, 130,380 Current liabilities Creditors Tax Sub total - Current liabilities 6 7 27,094,458 18,818,614 45,913,072 1,062,553,642 885,470,528 1,948,024,170 Total Equity and Liabilities 7,961,942,432 6,857,154,550 STATEMENT OF COMPREHENSIVE INCOME FOR THE YEARD ENDED 31ST DECEMBER 2017 Note 31.12.2017 Tshs 31.12.2016 TShs 30,863,518,997 26,837,842,606 Revenue 21,636.803,012 19,323,246,677 Cost of Sales 9,226,715,985 7,514,595,929 GROSS PROFIT 54,169,138 34 966,565 Financial expenses 384,074,339 294,604 900 Personnel expenses 3,827,813,152 2,177.213.014 Operating Expenses 10,112,673 14,005,025 Depriciation 4,276,169,302 2,520,789,504 4,950,546,683 4,993,806,425 Profit from Operating Activities Before Taxation Taxation 1.485,164005 1.498,141.928 3,465,382.678 3.495,664 498 Profit from Operating Activities After Taxation 0 Other Comprehensive Incomel(Loss) 3,465.382 678 3.495.664.498 Total Comprehensive Income STATEMENT OF FINANCIAL POSITION AS AT 31ST DECEMBER 2017 Note 31.12.2017 31.12.2016 ASSETS Non-Current Assets Property, Plant & Equipment 7 70,788,710 39,869,913 CURRENT ASSETS Closing Stock Trade and Other Receivables Cash and Cash Equivalents 9,770,099,825 769,820,539 2307,233,289 12,847,153,652 6 7.361,213,463 1,403071,370 2645.487 076 11.409,771, 909 Total Assets 12,917,942,363 11,449,641,822 EQUITY AND LIABILITIES Capital and Reserves Share Capital Retain Eanings Total Equity 802,000,000 11,088.624,237 11,890,624,237 802,000,000 10,609,693,859 11,411,693,859 Current Liabilities Trade and Other Payables Taxation Loan va 21,012,192 6.305,933 1,000,000,000 1,027,318,125 10,987423 26 960.540 37,947,963 Total Equity and Liabilities 12,917,942,363 11,449,641,822 STATEMENT OF COMPREHENSIVE INCOME FOR THE YEAR ENDED 31ST DECEMBER 2015 31.12.2015 TSHS Notes 31.12.2014 TSHS INCOME 8 8 23,750,303,191 21,789,268,983 Less: Costof Sales 9 17,159,594,056 15,851,693,185 6,590,709,136 5,937,575,798 Gross Profit Less: Operating expenses Staff Administrative Financial - less loan interest Total 10 11 12 245,087,416 2,044,331,469 3,464,976 2,292,883,861 196,079,695 1,942,357,692 8,867,132 2,147,304,518 Opg profit before loan interest, tax and depreciation & amortization (EBITDA) 4,297,825,274 3,790,271,280 Less: Depreciation 2 2.255,303 8.572,178 Profit before interest and tax (EBIT) 4,295,569,972 3,781,699,102 Less: Loan interest Profit before tax (EBT) 4,295,569,972 3,781,699,102 Less: Corporation Tax @ 30% 1,288,670,992 1,134,509,731 Profit after tax (EAT) 3,006,898,980 2,647,189,371 STATEMENT OF FINANCIAL POSITION AS AT 31ST DECEMBER 2016 NOTES 31.12.2016 TSHS ent of Capital 31.12.2015 TSHS 2 39 869,913 8,262,613 Assets 3 4 cash equivalents Current assets 7,361,213,463 1,403.071,370 2,645,487 076 11.409,771,909 1.711,098,366 1,730,424,049 4,512.157,404 7.953,679.820 sets 11,449,641,822 7,961,942,432 and by and Liabillities 5 Capital red earnings - Equity 802,000,000 10,609 693.859 11,411,693.859 802.000.000 7,114,029,361 7,916,029,361 bes liabilities stors 6 7 10.987.423 26,960,540 37,947,963 27,094 458 18.818.614 45,913,072 Total - Current liabilities Equity and Liabilities 11,449,641,822 7,961,942,432 MANAGEMENT ACCOUNTS STATEMENT OF FINANCIAL POSITION AS AT 30TH SEPTEMBER 2018 Note 30.09.2018 Tshs 31.12.2017 TShs ASSETS Non-Current Assets Property, Plant & Equipment Construction Work in Progress 7 70,788,710 270,274,003 3,074,791,820 CURRENT ASSETS Closing Stock Trade and Other Receivables Cash and Cash Equivalents 7,919,313,707 986,164,996 3.057.494525 11.962,973,228 9,770,099,825 769.820.539 2.307.233.289 12.847,153,653 6 15,308,039,051 12,917,942,363 Total Assets EQUITY AND LIABILITIES Capital and Reserves Share Capital Retain Eanings Total Equity 802,000,000 13.673.296.934 14,475,296,934 802,000,000 11,088,624,237 11.890.624,237 Current Liabilities Trade and Other Payables Taxation Loan 5 32,152,800 8,127,710 792,461,607 832,742,117 21.012.192 6,305,933 1,000,000,000 1,027,318,125 Total Equity and Liabilities 15,308,039,051 12,917,942,363 STATEMENT OF FINANCIAL POSITION AS AT 31ST DECEMBER 2016 NOTES 31.12.2016 TSHS 31.12.2015 TSHS ment of Capital sats 2 39.869,913 8,262,613 assets 3 A cash equivalents arent assets 7,361 213,463 1,403.071,370 2,645,487,076 11,409,771,909 1,711,098,366 1,730,424,049 4.512.157,404 7,953,679 820 11,449,641,822 7,961,942,432 ed by and Liabilities 5 Capital med earnings - Equity 802,000,000 10.609.693,859 11,411,693,859 802.000.000 7,114,029,361 7,916.029,361 liabilities sitors 6 7 10 987.423 26,960,540 37,947,963 27,094.458 18.818,614 45,913,072 total - Current liabilities Equity and Liabilities 11,449,641,822 7,961,942,432 MANAGEMENT ACCOUNTS STATEMENT OF COMPREHENSIVE INCOME FOR THE PERIOD ENDED 30TH SEPTEMBER 2018 Note 30.09.2018 Taha 31.12.2017 TShs Revenue 25.759,820,905 30,863,518,997 Cost of Sales 19,322,783,911 21,636 803,012 GROSS PROFIT 6,437,036,994 2,228,715,985 Financial expenses 122.940,167 54,169,139 Personnel expenses 343,501,017 384,074,339 Operating Expenses 2,250,246,865 3,827 813,151 Depriciation 27,959,380 10,112,673 2,744,847,429 4,276,169,302 Profit from Operating Activities Before Taxation 3,892,389,566 4,950,546,683 Taxation 1,107,716,870 1,485,164,005 Profit from Operating Activities After Taxation 2.584.672.696 3.465,382.678 Other Comprehensive Incomel(Loss) 0 OLI Total Comprehensive Income 2.584,672.696 3,465,382.678 STATEMENT OF FINANCIAL POSITION AS AT 31ST DECEMBER 2015 YEAR NOTES 31.12.2015 TSHS 31.12.2014 TSHS EMPLOYMENT OF CAPITAL Fixed Assets 2 8,262,613 10,367,915 Current Assets Stocks Debtors Cash & cash equivalents 3 4 1.711,098,366 1,730,424,049 4,512,157,404 2,060,125,531 750,339,198 4,036,321,907 Total Current assets 7,953,679.820 6,846,786,635 Total Assets 7,961,942,432 6,857,154,550 Financed by Equity and Liabillities Equity Share Capital Retained earnings Sub total - Equity 6 802,000,000 7,114,029,361 7,916,029,361 802,000,000 4,107,130,380 4,909, 130,380 Current liabilities Creditors Tax Sub total - Current liabilities 6 7 27,094,458 18,818,614 45,913,072 1,062,553,642 885,470,528 1,948,024,170 Total Equity and Liabilities 7,961,942,432 6,857,154,550 STATEMENT OF COMPREHENSIVE INCOME FOR THE YEARD ENDED 31ST DECEMBER 2017 Note 31.12.2017 Tshs 31.12.2016 TShs 30,863,518,997 26,837,842,606 Revenue 21,636.803,012 19,323,246,677 Cost of Sales 9,226,715,985 7,514,595,929 GROSS PROFIT 54,169,138 34 966,565 Financial expenses 384,074,339 294,604 900 Personnel expenses 3,827,813,152 2,177.213.014 Operating Expenses 10,112,673 14,005,025 Depriciation 4,276,169,302 2,520,789,504 4,950,546,683 4,993,806,425 Profit from Operating Activities Before Taxation Taxation 1.485,164005 1.498,141.928 3,465,382.678 3.495,664 498 Profit from Operating Activities After Taxation 0 Other Comprehensive Incomel(Loss) 3,465.382 678 3.495.664.498 Total Comprehensive Income STATEMENT OF FINANCIAL POSITION AS AT 31ST DECEMBER 2017 Note 31.12.2017 31.12.2016 ASSETS Non-Current Assets Property, Plant & Equipment 7 70,788,710 39,869,913 CURRENT ASSETS Closing Stock Trade and Other Receivables Cash and Cash Equivalents 9,770,099,825 769,820,539 2307,233,289 12,847,153,652 6 7.361,213,463 1,403071,370 2645.487 076 11.409,771, 909 Total Assets 12,917,942,363 11,449,641,822 EQUITY AND LIABILITIES Capital and Reserves Share Capital Retain Eanings Total Equity 802,000,000 11,088.624,237 11,890,624,237 802,000,000 10,609,693,859 11,411,693,859 Current Liabilities Trade and Other Payables Taxation Loan va 21,012,192 6.305,933 1,000,000,000 1,027,318,125 10,987423 26 960.540 37,947,963 Total Equity and Liabilities 12,917,942,363 11,449,641,822 STATEMENT OF COMPREHENSIVE INCOME FOR THE YEAR ENDED 31ST DECEMBER 2015 31.12.2015 TSHS Notes 31.12.2014 TSHS INCOME 8 8 23,750,303,191 21,789,268,983 Less: Costof Sales 9 17,159,594,056 15,851,693,185 6,590,709,136 5,937,575,798 Gross Profit Less: Operating expenses Staff Administrative Financial - less loan interest Total 10 11 12 245,087,416 2,044,331,469 3,464,976 2,292,883,861 196,079,695 1,942,357,692 8,867,132 2,147,304,518 Opg profit before loan interest, tax and depreciation & amortization (EBITDA) 4,297,825,274 3,790,271,280 Less: Depreciation 2 2.255,303 8.572,178 Profit before interest and tax (EBIT) 4,295,569,972 3,781,699,102 Less: Loan interest Profit before tax (EBT) 4,295,569,972 3,781,699,102 Less: Corporation Tax @ 30% 1,288,670,992 1,134,509,731 Profit after tax (EAT) 3,006,898,980 2,647,189,371