evaluate the solvency of both companies and compare
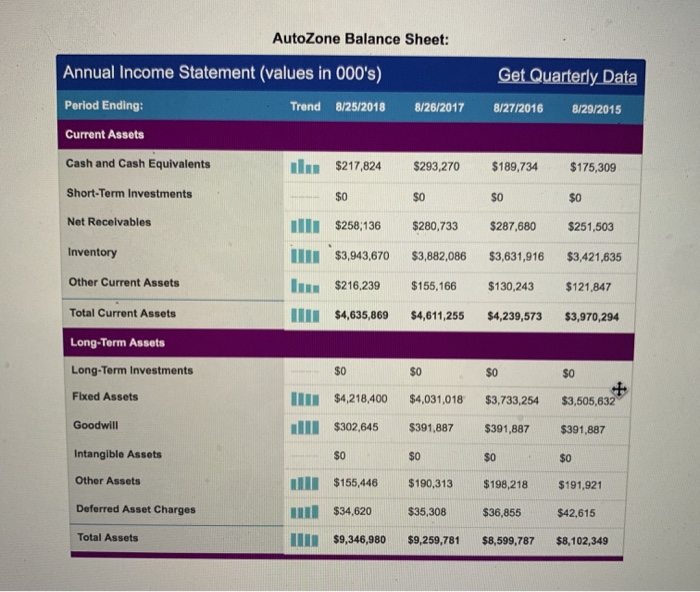
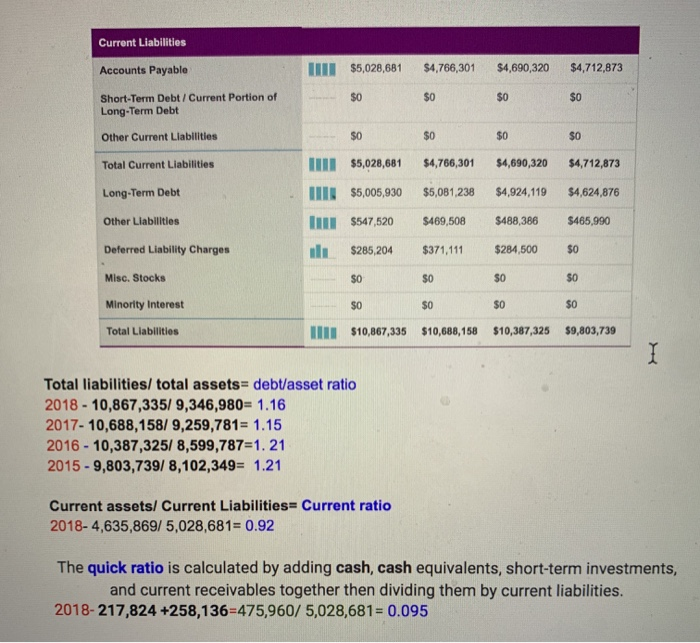
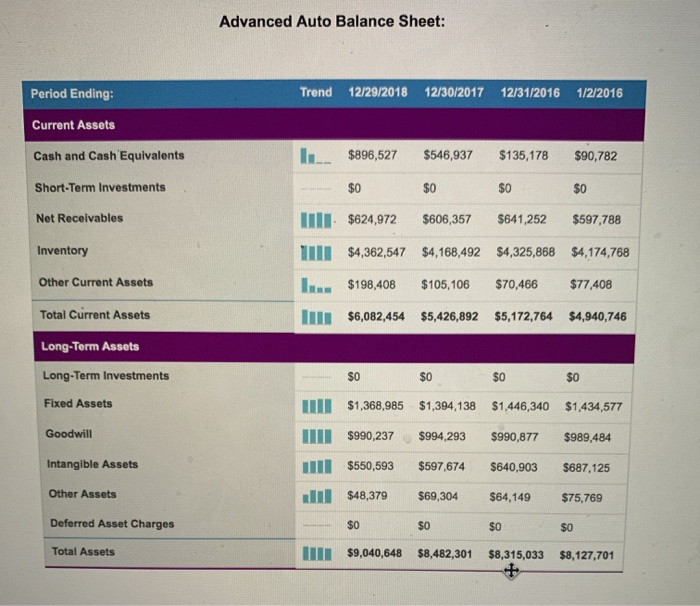
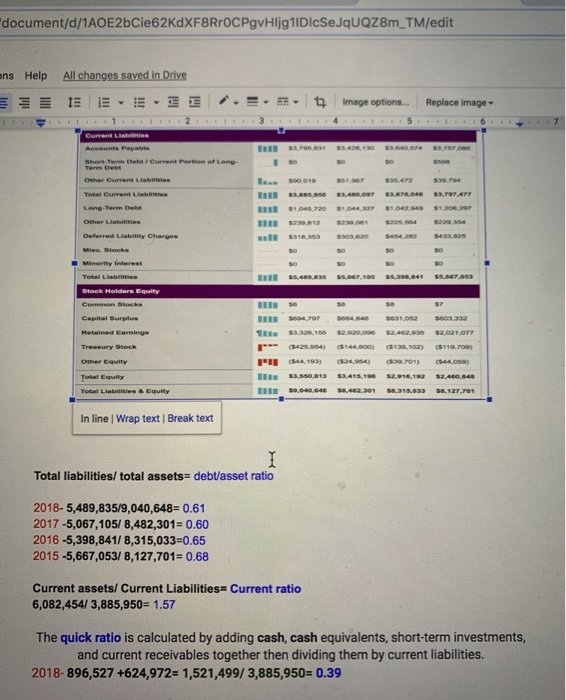
AutoZone Balance Sheet: Annual Income Statement (values in 000's) Get Quarterly Data Period Ending: Trend 8/25/2018 8/26/2017 8/27/2016 8/29/2015 Current Assets Cash and Cash Equivalents l$217,824 $293,270 $189,734 $175,309 Short-Term Investments $0 $0 $0 $0 Net Recelvables $258,136 $280,733 $287,680 $251,503 Inventory $3,943,670 $3,882,086 $3,631,916 $3,421,635 Other Current Assets I $216,239 $155,166 $130,243 $121,847 I$4,635,869 Total Current Assets $4,611,255 $4,239,573 $3,970,294 Long-Term Assets Long-Term Investments $0 $0 $0 $0 Fixed Assets $4,218,400 $4,031,018 $3,733,254 $3,505,632 Goodwill $302,645 $391,887 $391,887 $391,887 Intangible Assets $0 $0 $0 $0 Other Assets $155,446 $190,313 $198,218 $191,921 Deferred Asset Charges $34,620 $35,308 $36,855 $42,615 Total Assets IIII $9,346,980 $9,259,781 $8,599,787 $8,102,349 Current Liabilities $5,028,681 $4,766,301 $4,690,320 $4,712,873 Accounts Payable Short-Term Debt/Current Portion of Long-Term Debt $0 $0 $0 $0 $0 $0 $0 $0 Other Current Liabilities $4,766,301 $5,028,681 $4,690,320 $4,712,873 Total Current Liabilities $5,081,238 $4,924,119 $4,624,876 $5,005,930 Long-Term Debt I $547,520 $469,508 $488,386 $465,990 Other Liabilities $0 Deferred Liability Charges $371,111 $284,500 $285,204 $0 $0 Misc. Stocks $0 $0 Minority Interest $0 $0 $0 $0 $10,688,158 $10,387,325 $9,803,739 Total Liabilities $10,867,335 I Total liabilities/ total assets= debt/asset ratio 2018-10,867,335/ 9,346,980= 1.16 2017-10,688,158/ 9,259,781 1.15 2016 10,387,325/ 8,599,787=1. 21 2015-9,803,739/ 8,102,349 1.21 Current assets/Current Liabilities= Current ratio 2018-4,635,869/5,028,681 0.92 The quick ratio is calculated by adding cash, cash equivalents, short-term investments, and current receivables together then dividing them by current liabilities. 2018-217,824 +258,136-475,960/ 5,028,681=0.095 Advanced Auto Balance Sheet: Trend 12/29/2018 12/30/2017 12/31/2016 Period Ending: 1/2/2016 Current Assets Cash and Cash Equivalents $896,527 $546,937 $135,178 $90,782 Short-Term Investments $0 $0 $0 $0 I$624,972 Net Receivables $606,357 $641,252 $597,788 W$4,362,547 $4,168,492 $4,325,868 Inventory $4,174,768 Other Current Assets $198,408 $105,106 $70,466 $77,408 Total Current Assets $6,082,454 $5,426,892 $5,172,764 $4,940,746 Long-Term Assets Long-Term Investments $0 $0 $0 $0 Fixed Assets $1,368,985 $1,394,138 $1,446,340 $1,434,577 Goodwill $990,237 $994,293 $990,877 $989,484 Intangible Assets $550,593 $597,674 $640,903 $687,125 Other Assets $48,379 $69,304 $64,149 $75,769 Deferred Asset Charges $0 $0 $0 $0 l $9,040,648 Total Assets $8,482,301 $8,315,033 $8,127,701 document/d/1AOE2bCie62KdXF8RrOCPgvHljg1 IDIcSeJqUQZ8m_TM/edit All changes saved in Drive ns Help E E Image options... Replace image- I 4 5 I 6 I 1 I 2 Current Liabiies Aceounts Payable s3428 130 $3640 574 s3,757 085 Short-Term Debt /Current Portion ot Leng- so so so s500 Other Curent Liabittes l...so0.019 s51.967 s35.472 $39.794 Tetal Current Liabitities 3esse s3,480,097 s3.676,046 3,797 ATT 1,045,720 $.044 327 Long-Termm Debt $1,042949 $1,206.297 Other Liabilities $230.812 s230.061 s225,s64 $229354 s30320 Deferred Liability Charues l 31n,353 s454 282 $433,925 Misc. Stocks so so so so Minority interest so so so so s54esaas ss.067,105 s5,667,053 Total Liabilities ss398841 Stock Holders Equity Common Stocks se sa se se31,052 sec3.332 Capital Surplue seo,797 see46 s2.920,09 s2.021,077 1 Retained Earnings $3.3ze,155 s2462.935 (3425,954) (5144600) $138.102) Treasury Stock ($119,709) s24954 Other Equaity PI 44,193) s39701) (344.059) 3,5so.a13 s3,415,196 $2,460,64 s2.916,192 Total Equity sa482.301 s9,040,64 s8.315.033 Total Liabilities & Equity s8,127,701 In line | Wrap text | Break text Total liabilities/ total assets= debt/asset ratio 2018-5,489,835/9,040,648-= 0.61 2017-5,067,105/ 8,482,301- 0.60 2016 -5,398,841/ 8,315,033-0.65 2015-5,667,053/ 8,127,701 0.68 Current assets/ Current Liabilities= Current ratio 6,082,454/ 3,885,950= 1.57 The quick ratio is calculated by adding cash, cash equivalents, short-term investments, and current receivables together then dividing them by current liabilities. 2018-896,527 +624,972= 1,521,499/ 3,885,950= 0.39