Answered step by step
Verified Expert Solution
Link Copied!

Question

1 Approved Answer

Evaluating Turnover Ratios Across Industries The table that follows reports balance sheet and income statement information for Nike, Best Buy, John- son & Johnson, and
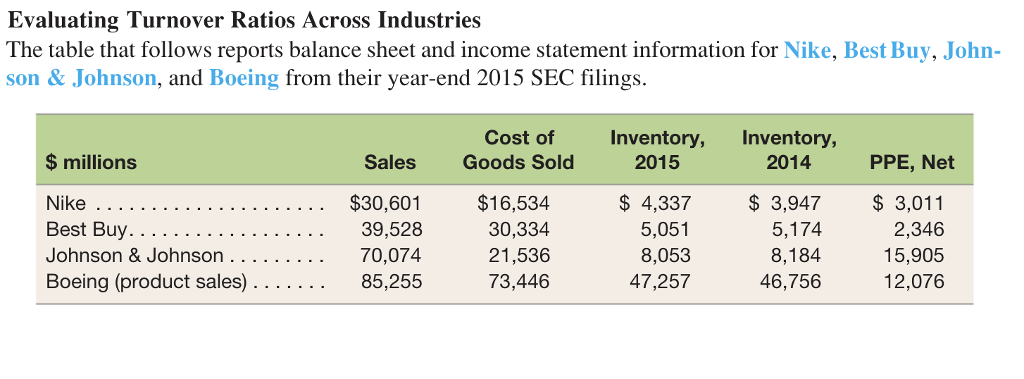
image text in transcribed

image text in transcribed

Evaluating Turnover Ratios Across Industries The table that follows reports balance sheet and income statement information for Nike, Best Buy, John- son & Johnson, and Boeing from their year-end 2015 SEC filings. Cost of Goods Sold Inventory, Inventory, $ millions Sales 2015 2014 PPE, Net $16,534 30,334 21,536 73,446 $30,601 39,528 $ 4,337 5,051 8,053 47,257 $3,947 5,174 8,184 46,756 3,011 2,346 15,905 12,076 85,255

Step by Step Solution

There are 3 Steps involved in it

Step: 1

blur-text-image

Get Instant Access to Expert-Tailored Solutions

See step-by-step solutions with expert insights and AI powered tools for academic success

Step: 2

blur-text-image_2

Step: 3

blur-text-image_3

Ace Your Homework with AI

Get the answers you need in no time with our AI-driven, step-by-step assistance

Get Started

Recommended Textbook for

Real Estate Finance and Investments

Authors: William Brueggeman, Jeffrey Fisher

14th edition

73377333, 73377339, 978-0073377339

More Books

Students also viewed these Finance questions