

Question
Evaluation/Grading of your Final Project Math 302 Final Project will open up Friday morning of Week 6 in the course. You have 3 full weekends
Evaluation/Grading of your Final Project
Math 302 Final Project will open up Friday morning of Week 6 in the course. You have 3 full weekends to review and work on the Final Project.
Content addressed in the Final Project
In the final project, you are given a data set and a regression output. The concept of a data set should be something that you are familiar with because you collected one during Week 1. There are descriptive statistics that go along with said data set, which should also be familiar because you calculated descriptive statistics during Week 2. The Regression output won't look familiar to you until Week 7. Once you go through the Lessons and the Discussion Forum, (particularly your second response post) you should be familiar on how to run a Regression and what a Regression output looks like from the ToolPak. By the end of Week 7, you will have all the information needed to write up the Final Project. There is nothing new that you learn in Week 8 needed for the write up of the final project.
Final Project Overview
The final project is worth 100 points and no calculations are needed. You will write up an Executive Summary on what city you chose to open a second location in and justify the results.
Grading Breakdown:
1) Executive Summary - up to 10% a. Please review what an Executive Summary looks like: ? What is an Executive Summary? b. Must have cover page.
2) Grammar - up to 10% a. Spell and grammar check your work. b. Make sure you have correct punctuation and complete sentences.
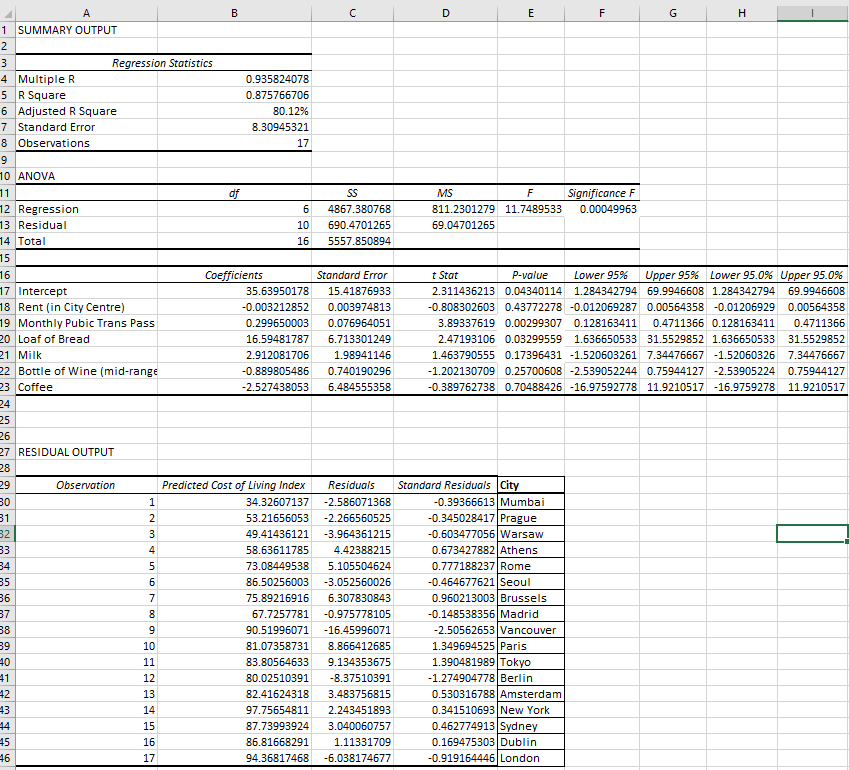
3) State significant predictors - up to 25%
a. Must state which predictors are significant at predicting Cost of Living and how do you know.
b. Show the comparison to alpha to state your results and conclusion.
c. Do these significant predictors make sense, if you want to relocate?
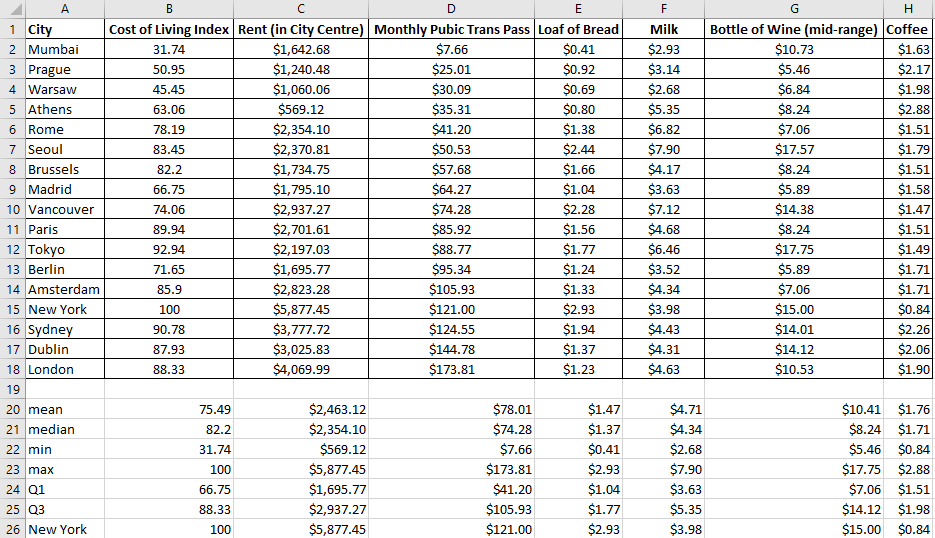
4) Discuss descriptive statistics for the significant predictors - up to 25%
a. From the significant predictors, review the mean, median, min, max, Q1 and Q3 values.
b. What city or cities fall above or below the median and/or the mean?
c. What city or cities are in the upper 3rd quartile? Or the bottom quartile?
d. How do these predictors compare to the baseline of NYC? What cost more or less money than NYC?
5) Recommend at least 2 cities to open a second location in - up to 30%
a. You must justify your answer for full credit.
b. You need to use the Significant Predictors AND Descriptive Statistics in your justification.
c. Justification without the use of Significant Predictors WILL NOT get full credit.
d. Justification without the use of Descriptive Statistics WILL NOT get full credit. You need to use both.
e. For example, let's look back at London. London at 88.33, is 11.67% less expensive than NYC. But that doesn't mean London is a good place to open a second location once you discuss the significant predictors and how it relates back to each city.
f. Use what you have learned in the course and analyze all the data not just what you see on the surface.
g. You must use the numbers and the output to justify your answers. Do not use any outside resources to justify your answer. Only use Significant Predictors AND Descriptive Statistics.
Step by Step Solution
There are 3 Steps involved in it
Step: 1

Get Instant Access to Expert-Tailored Solutions
See step-by-step solutions with expert insights and AI powered tools for academic success
Step: 2

Step: 3
Ace Your Homework with AI
Get the answers you need in no time with our AI-driven, step-by-step assistance
Get Started
Calculus Early Transcendentals
Authors: James Stewart
7th edition
538497904, 978-0538497909