Answered step by step
Verified Expert Solution
Link Copied!
Question
1 Approved Answer

Evander Inc. has dedied to use the high-low method to estimate the total cost and the fixed and variable cost components of the total cost.
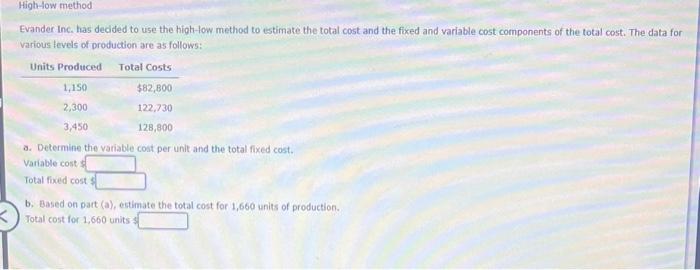
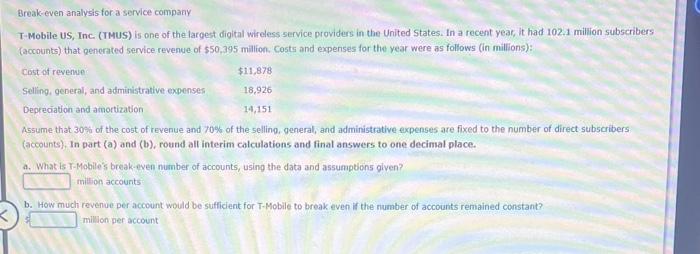
image text in transcribed
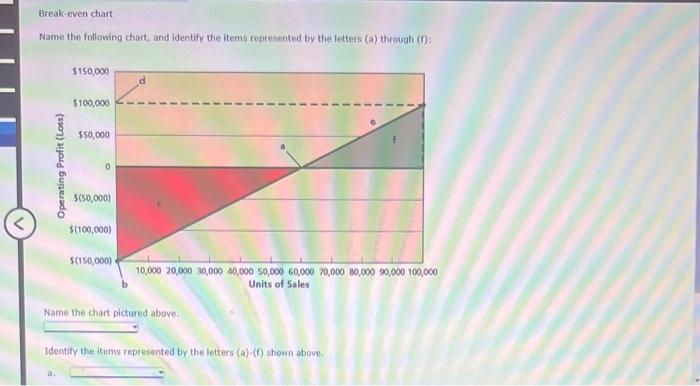
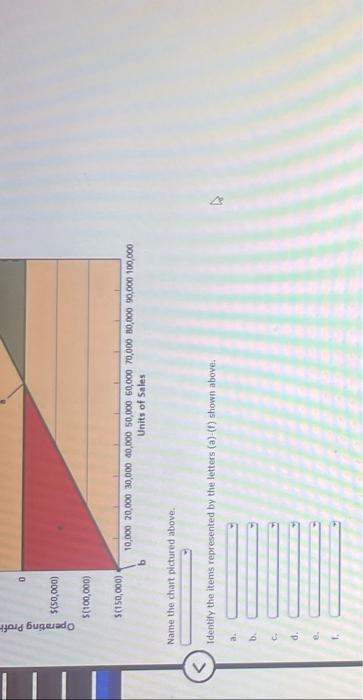
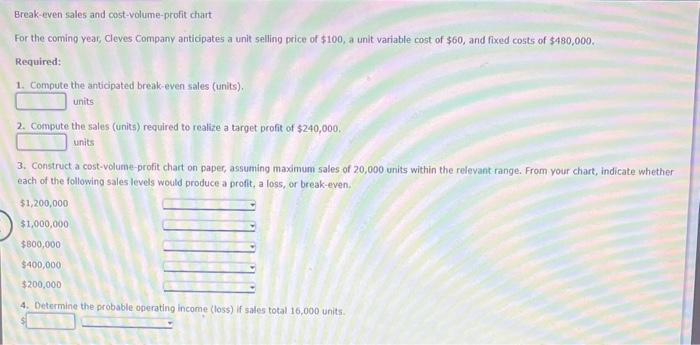
Evander Inc. has dedied to use the high-low method to estimate the total cost and the fixed and variable cost components of the total cost. The data for various fevels of production are as follows: a. Determine the variable cost per unit and the total fixed cost. Variable cost 3 Total fixed cost 4 b. Based on part (a), estimate the total cost for 1,660 units of production. Total cost for 1,660 units ? Break-even analysis for a service company T-Mobile US, Inc. (TMUS) is one of the largest digital wireless service providers in the United States. In a recent yeat, it had 102.1 million subscribers (accounts) that qenenated service revenue of $50,395 million. Costs and expenses for the year were as follows (in millions): A5sume that 30s of the cost of revenue and 70% of the selling. general, and administrative expenses are fixed to the number of direct subscribers (acoounts), In part (a) and (b), round all interim calculations and final answers to one decimal place. a. What is T-Mobile's break-even number of accounts, using the data and assumptions given? mitision accounts b. How much revenue per account would be sufficient for T-Mobile to break even if the number of accounts remained constant? million per account Break-even sales and cost-volume-profit chart For the coming year, Cleves Company anticipates a unit selling price of $100, a unit variable cost of $60, and fixed costs of $480,000. Required: 1. Compute the anticipated break-even sales (units). units 2. Compute the sales (units) required to realize a target profit of $240,000. units 3. Construct a cost-volume-profit chart on paper, assuming maximum sales of 20,000 units within the relevant range. From your chart, indicate wheth each of the following sales levels would produce a profit, a loss, or break-even. 4. Determine the probable operating income (loss) if sales total 16,000 units. Break-even chart Name the following chart, and identify the items represented by the letters (a) through (D): Name the chart pictured above. Identify the itens represented by the letters (a)-(f) shown above, 3. Name the chart pictured above. Identify the items represented by the letters (a)=(t) shown above
Step by Step Solution

There are 3 Steps involved in it

Step: 1

blur-text-image
Get Instant Access to Expert-Tailored Solutions

See step-by-step solutions with expert insights and AI powered tools for academic success

Step: 2

blur-text-image_2

Step: 3

blur-text-image_3

Ace Your Homework with AI

Get the answers you need in no time with our AI-driven, step-by-step assistance

Get Started

Recommended Textbook for

The Information Audit A Practical Guide

Authors: Susan Henczel, Sue Henczel

1st Edition

3598243677, 978-3598243677

More Books

Students explore these related Accounting questions