

Question
EV/EBITDA multiples can be used to benchmark or determine the potential acquisition price (where Enterprise Value= Net Debt + Market Equity Value). What is the
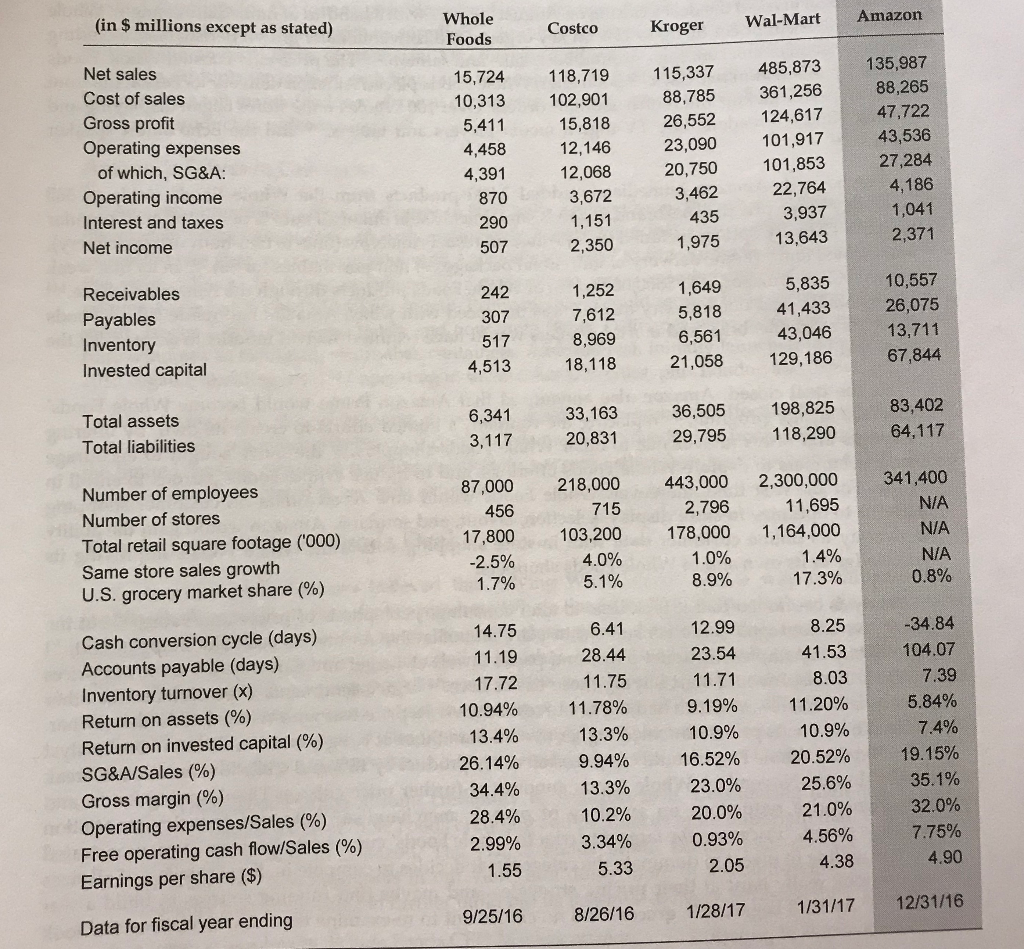
EV/EBITDA multiples can be used to benchmark or determine the potential acquisition price (where Enterprise Value= Net Debt + Market Equity Value). What is the implied enterprise value for Whole Foods using the industry average EV/EBITDA for fiscal year 2016? Use the data from Exhibit for a top down EBITDA calculation (Starting from EBIT not Net Income). Assumptions: Depreciation & Amortization in fiscal 2016 of $498 million, net debt at fiscal 2016 year end of $300 million, EV/EBITDA grocery industry average multiple of 7x.
a. $10.7 bln
b. $9.6 bln
c. $13.7 bln
d. $13.4 bln
It CAN'T be none. I keep getting the wrong answer. Please respond as soon as you reasonably can.
(in $ millions except as stated) Whole Foods Costco Kroger Wal-Mart Wal-M Amazon Net sales Cost of sales Gross profit Operating expenses of which, SG&A: Operating income Interest and taxes Net income 15,724 10,313 5,411 4,458 4,391 870 290 507 118,719 102,901 15,818 12,146 12,068 3,672 1,151 2,350 115,337 88,785 26,552 23,090 20,750 3,462 435 1,975 485,873 361,256 124,617 101,917 101,853 22,764 135,987 88,265 47,722 43,536 27,284 4,186 1,041 2,371 3,937 13,643 Receivables Payables Inventory Invested capital 242 307 517 4,513 1,252 7,612 8,969 18,118 1,649 5,818 6,561 21,058 5,835 41,433 43,046 129,186 10,557 26,075 13,711 67,844 Total assets Total liabilities 6,341 3,117 33,163 20,831 36,505 29,795 198,825 118,290 83,402 64,117 Number of employees Number of stores Total retail square footage ('000) Same store sales growth U.S. grocery market share (%) 87,000 456 17,800 -2.5% 1.7% 218,000 715 103,200 4.0% 5.1% 443,000 2,796 178,000 1.0% 8.9% 2,300,000 11,695 1,164,000 1.4% 17.3% 341,400 N/A N/A 0.8% Cash conversion cycle (days) Accounts payable (days) Inventory turnover (X) Return on assets (%) Return on invested capital (%) SG&A/Sales (%) Gross margin (%) Operating expenses/Sales (%) Free operating cash flow/Sales (%) Earnings per share ($) 14.75 11.19 17.72 10.94% 13.4% 26.14% 34.4% 28.4% 2.99% 1.55 6.41 28.44 11.75 11.78% 13.3% 9.94% 13.3% 10.2% 3.34% 12.99 23.54 11.71 9.19% 10.9% 16.52% 23.0% 20.0% 0.93% 2.05 8.25 41.53 8.03 11.20% 10.9% 20.52% 25.6% 21.0% 4.56% 4.38 -34.84 104.07 7.39 5.84% 7.4% 19.15% 35.1% 32.0% 7.75% 4.90 5.33 Data for fiscal year ending 9/25/16 8/26/16 1/28/17 1/31/17 12/31/16Step by Step Solution
There are 3 Steps involved in it
Step: 1

Get Instant Access to Expert-Tailored Solutions
See step-by-step solutions with expert insights and AI powered tools for academic success
Step: 2

Step: 3
Ace Your Homework with AI
Get the answers you need in no time with our AI-driven, step-by-step assistance
Get Started
The Practical Guide To Wall Street Equities And Derivatives
Authors: Matthew Tagliani
1st Edition
0470383720, 978-0470383728