Answered step by step
Verified Expert Solution
Question
1 Approved Answer
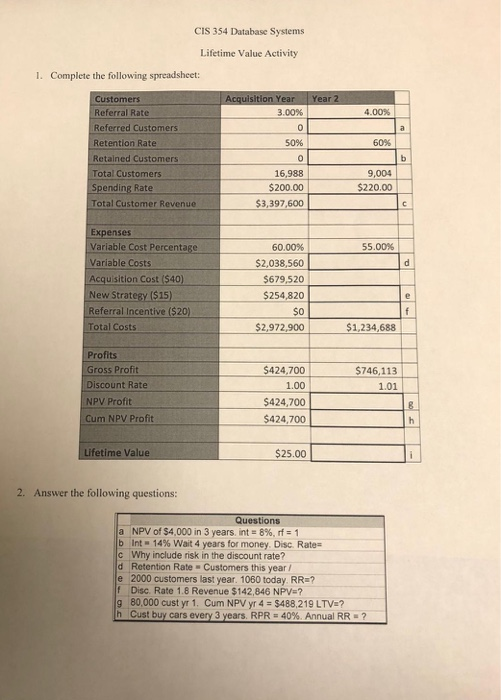
every question should be independent here is a sample answer CIS 354 Database Systems Lifetime Value Activity 1. Complete the following spreadsheet: Year 2 4.00%

every question should be independent here is a sample answer 
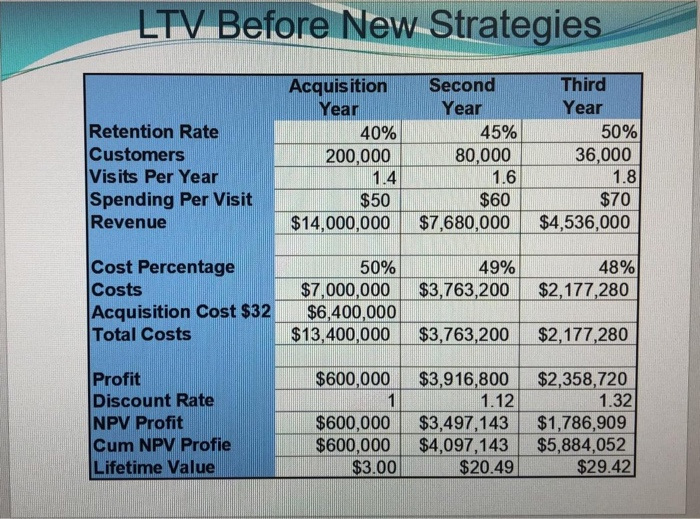
CIS 354 Database Systems Lifetime Value Activity 1. Complete the following spreadsheet: Year 2 4.00% 60% Customers Referral Rate Referred Customers Retention Rate Retained Customers Total Customers Spending Rate Total Customer Revenue Acquisition Year are 3.00% 0 50% 0 16,988 $200.00 $3,397,600 9,004 $220.00 55.00% Expenses Variable Cost Percentage Variable costs Acquisition Cost ($40) New Strategy ($15) Referral Incentive ($20) Total Costs 60.00% $2,038,560 $679,520 $254, 820 $0 $2,972,900 e $1,234,688 Profits Gross Profit Discount Rate NPV Profit Cum NPV Profit $746,113 1.01 $424,700 1.00 $424,700 $424,700 Lifetime Value $25.00 2. Answer the following questions: Questions a NPV of $4,000 in 3 years, int = 8%, rf = 1 b Int 14% Wait 4 years for money. Disc. Rate= C Why include risk in the discount rate? d Retention Rate - Customers this year / e 2000 customers last year. 1060 today. RRE? Disc. Rate 1.8 Revenue $142,846 NPV=? 9 80,000 cust yr 1. Cum NPV yr 4 = $488,219 LTV:? h Cust buy cars every 3 years. RPR = 40%. Annual RR = ? LTV Before New Strategies Retention Rate Customers Visits Per Year Spending Per Visit Revenue Acquisition Year 40% 200,000 1.4 $50 $14,000,000 Second Year 45% 80,000 1.6 $60 $7,680,000 Third Year 50% 36,000 1.8 $70 $4,536,000 49% $3,763,200 48% $2,177,280 Cost Percentage Costs Acquisition Cost $32 Total Costs 50% $7,000,000 $6,400,000 $13,400,000 $3,763,200 $2,177,280 $600,000 Profit Discount Rate NPV Profit Cum NPV Profie Lifetime Value $600,000 $600,000 $3.00 $3,916,800 1.12 $3,497,143 $4,097,143 $20.49 $2,358,720 1.32 $1,786,909 $5,884,052 $29.42 CIS 354 Database Systems Lifetime Value Activity 1. Complete the following spreadsheet: Year 2 4.00% 60% Customers Referral Rate Referred Customers Retention Rate Retained Customers Total Customers Spending Rate Total Customer Revenue Acquisition Year are 3.00% 0 50% 0 16,988 $200.00 $3,397,600 9,004 $220.00 55.00% Expenses Variable Cost Percentage Variable costs Acquisition Cost ($40) New Strategy ($15) Referral Incentive ($20) Total Costs 60.00% $2,038,560 $679,520 $254, 820 $0 $2,972,900 e $1,234,688 Profits Gross Profit Discount Rate NPV Profit Cum NPV Profit $746,113 1.01 $424,700 1.00 $424,700 $424,700 Lifetime Value $25.00 2. Answer the following questions: Questions a NPV of $4,000 in 3 years, int = 8%, rf = 1 b Int 14% Wait 4 years for money. Disc. Rate= C Why include risk in the discount rate? d Retention Rate - Customers this year / e 2000 customers last year. 1060 today. RRE? Disc. Rate 1.8 Revenue $142,846 NPV=? 9 80,000 cust yr 1. Cum NPV yr 4 = $488,219 LTV:? h Cust buy cars every 3 years. RPR = 40%. Annual RR = ? LTV Before New Strategies Retention Rate Customers Visits Per Year Spending Per Visit Revenue Acquisition Year 40% 200,000 1.4 $50 $14,000,000 Second Year 45% 80,000 1.6 $60 $7,680,000 Third Year 50% 36,000 1.8 $70 $4,536,000 49% $3,763,200 48% $2,177,280 Cost Percentage Costs Acquisition Cost $32 Total Costs 50% $7,000,000 $6,400,000 $13,400,000 $3,763,200 $2,177,280 $600,000 Profit Discount Rate NPV Profit Cum NPV Profie Lifetime Value $600,000 $600,000 $3.00 $3,916,800 1.12 $3,497,143 $4,097,143 $20.49 $2,358,720 1.32 $1,786,909 $5,884,052 $29.42 
Step by Step Solution
There are 3 Steps involved in it
Step: 1

Get Instant Access to Expert-Tailored Solutions
See step-by-step solutions with expert insights and AI powered tools for academic success
Step: 2

Step: 3

Ace Your Homework with AI
Get the answers you need in no time with our AI-driven, step-by-step assistance
Get Started


