Answered step by step
Verified Expert Solution
Question
1 Approved Answer
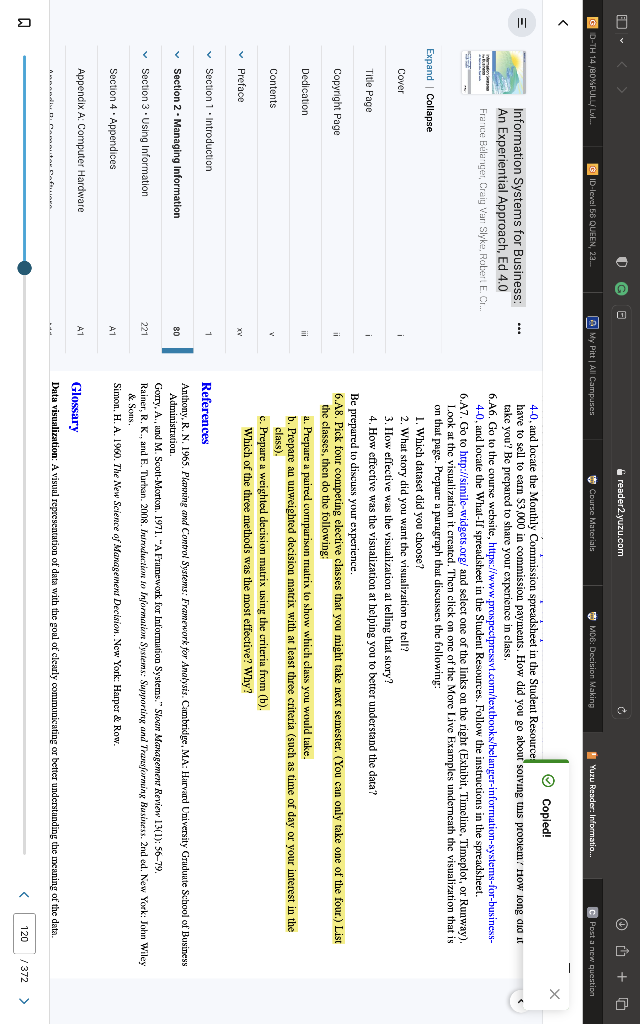
Everything highlighted yellow 4-0, and locate the Monthly Commission spreadsheet in the Student Resource Information Systems for Business: have to sell to earn $3,000 in

Everything highlighted yellow
4-0, and locate the Monthly Commission spreadsheet in the Student Resource Information Systems for Business: have to sell to earn $3,000 in commission payments. How did you go about solving ths probem: how long dio it An Experiential Approach, Ed 4.0 take you? Be prepared to share your experience in class. 6.A6. Go to the course website, https://www.prospectpressvt.com/texthooks/belanger-information-systerns-for-business- France Ela mger, Craiy van Slyke, Roter. E. Cl... 4-0, and locate the What-If spreadsheet in the Student Resources. Follow the instructions in the spreadsheet. 6.A7, Go to http://simile-widgets.org/ and select one of the links on the right (Exhibit, Timeline, Timeplot, or Runway). I.ook at the visualization it created. Then click on one of the More Live Examples underneath the visualization that is on that page. Prepare a paragraph that discusses the following: 1. Which dataset did you choose? 2. What story did you want the visualization to tell? 3. How effective was the visualization at telling that story? 4. How effective was the visualization at helping you to better understand the data? Be prepared to discuss your experience. 6.A8. Pick four competing elective classes that you might take next semester. (You can only take one of the four.) List the classes, then do the following: a. Prepare a paired cormparison matrix to show which class you would take. b. Prepare an unweighted decision matrix with at least three criteria (such as time of day or your interest in the class). c. Prepare a weighted decision matrix using the criteria from (b). Which of the three methods was the most effective? Why? References Anthony, R. N. 1965. Plemping and Control Systems: Framework for Anatysis. Cimbridige, MA: Harvand University Graduate School of Business Administrution. Gorry, A., and M. Scott-Morton. 1971. "A Framework for Informution Systems." Sloan Managemen Review 13(1): 56-79. Rainer, R. K., and E. Turkan. 2008. Inimeduction to Ingormation Sysiems: Sapgoring and Transfornung Businesss. 2nd ed. New York: John Wiley \& Sons. Simon, H. A. 1960. The New Science of Management Decision. New' York: Harper \& Row. Appendix A: Computer Hardware Glossary Data visualization: A visual representation of data with the goul of clearly communicating or better understanding the meaning of the dataStep by Step Solution
There are 3 Steps involved in it
Step: 1

Get Instant Access to Expert-Tailored Solutions
See step-by-step solutions with expert insights and AI powered tools for academic success
Step: 2

Step: 3

Ace Your Homework with AI
Get the answers you need in no time with our AI-driven, step-by-step assistance
Get Started


