Answered step by step
Verified Expert Solution
Link Copied!

Question

1 Approved Answer

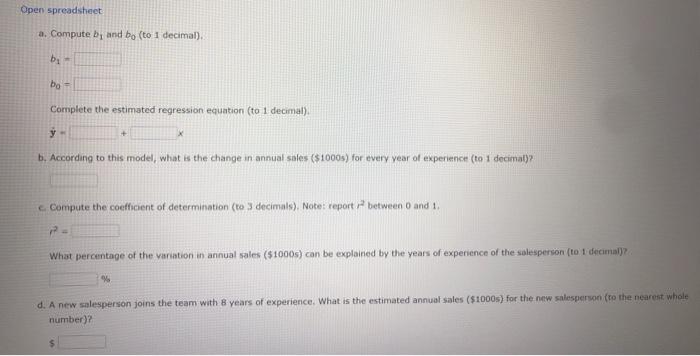
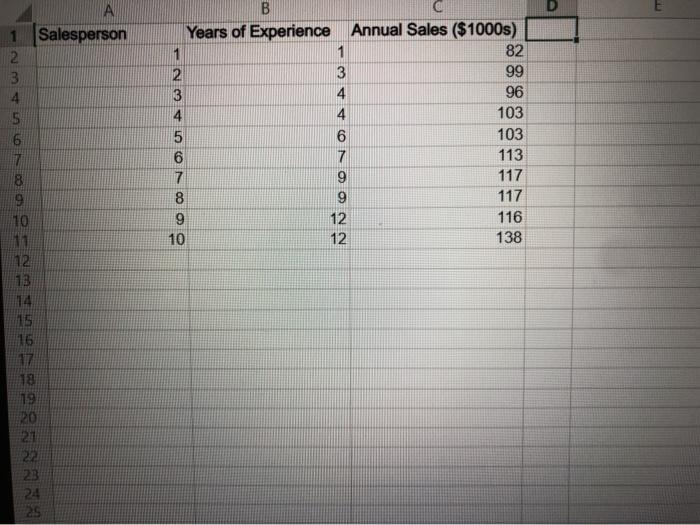
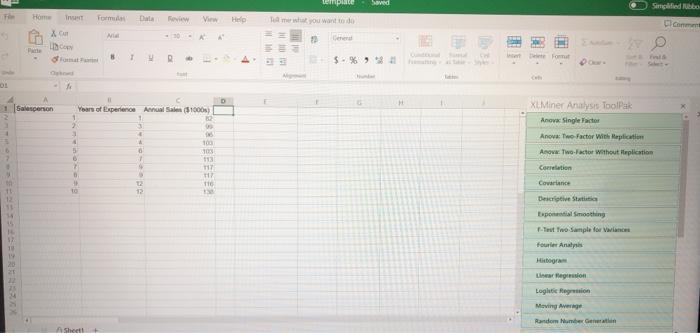
ex1.4 A sales manager collected data on annual sales for new customer accounts and the number of years of experience for a sample of 10

ex1.4
image text in transcribed
A sales manager collected data on annual sales for new customer accounts and the number of years of experience for a sample of 10 salespersons. In the Microsoft Excel Online file below you will find a sample of data on years of experience of the salesperson and annual sales. Conduct a regression analysis to explore the relationship between these two vanables and then answer the following questions. X Open spreadsheet a. Compute band bo (to 1 decimal). b; Do Complete the estimated regression equation (to I decimal) b. According to this model, what is the change in annual sales ($1000s) for every year of experience (to 1 decimal)? c. Compute the coefficient of determination (to 3 decimals). Note: report between 0 and 1 What percentage of the variation in annual sales ($1000s) can be explained by the years of experience of the salesperson (to 1 decimal? Open spreadsheet a. Compute band bo (to 1 decimal). bi- bo - Complete the estimated regression equation (to 1 decimal) y- + b. According to this model, what is the change in annual sales ($1000s) for every year of experience (to 1 decimat)? Compute the coefficient of determination (to 3 decimale). Note: report between 0 and 1 What percentage of the variation in annual sales ($1000s) can be explained by the years of experience of the salesperson (to 1 decimal)? d. A new salesperson joins the team with 8 years of experience. What is the estimated annual sales ($1000s) for the new salesperson to the nearest whole number)? XLMiner Analysis ToolPak X Anova: Single Factor Anova: Two-Factor With Replication Anova: Two-Factor Without Replication Correlation Covariance Descriptive Statistics Exponential Smoothing F-Test Two-Sample for Variances Fourier Analysis Histogram Linear Regression Logistic Regression Moving Average Random Number Generation Rant and Derrantile Moving Average Random Number Generation Rank and Percentile Sampling t-Test: Paired Two Sample for Means t-Test: Two-Sample Assuming Equal Variances t-Test: Two-Sample Assuming Unequal Variances z-Test: Two-Sample for Means Help. Examples, Upgrades template Sed Data View who want to do Home XC Simplified CIC M M of 8 MU H Sanson Years of experience Anal (51000) 2 - 88EEEE XL Miner Anabe Tollak Anova: Single Factor Anova: Two Factor with aplication Anow. Two-Factor without pliction Correlation Cowarance Descriptive Stati Exposmothing Frost no Sample for variance fourt Analysis Lier Hagen Lolitic Region Moving Average Random Humbex Gent Sht

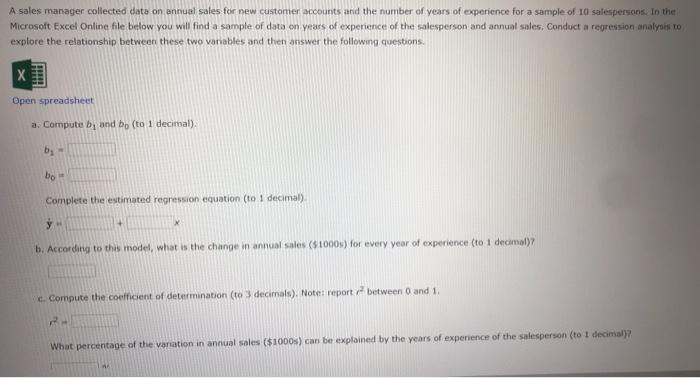
Step by Step Solution

There are 3 Steps involved in it

Step: 1

blur-text-image

Get Instant Access to Expert-Tailored Solutions

See step-by-step solutions with expert insights and AI powered tools for academic success

Step: 2

blur-text-image

Step: 3

blur-text-image

Ace Your Homework with AI

Get the answers you need in no time with our AI-driven, step-by-step assistance

Get Started

Recommended Textbook for

More Books

Students also viewed these Finance questions