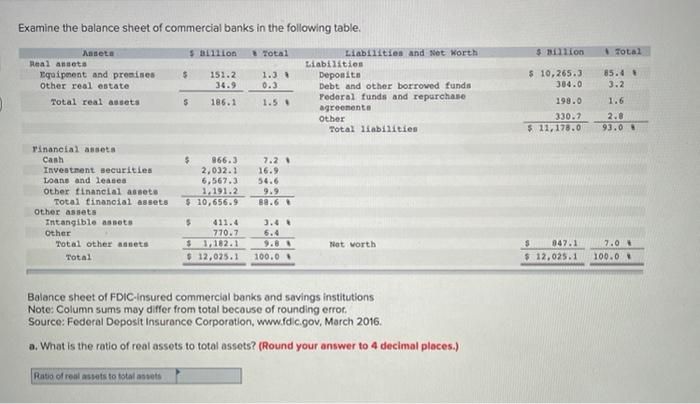
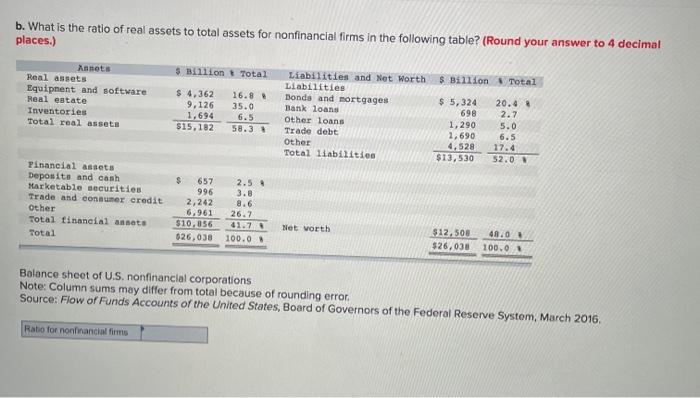
Examine the balance sheet of commercial banks in the following table. Sion Total $lion Total Asseta Real asets Equipment and promises Other real estate Total real assets $ 151.2 34.9 85.4 3.2 1.3 0.3 1.5 Liabilities and Net Worth Liabilities Deposito Debt and other borroved funds Federal funds and repurchase agreements Other Total liabilities 5 186.1 $ 10,265.) 384.0 198.0 330.2 $ 11,178.0 1.6 2.0 93.0 Tinancial asseta Cash Investment securities Loans and leases other financial assets Total financial assets other assets Intangible aneta Other Total other anets Total $ 866.3 2,032.1 6,567.3 1.191.2 $ 10,656.9 16.9 54.6 9.9 88.6 5 770.7 $ 3,182.1 $ 12,025.1 6.4 9.8 100.0 Not worth $ 947.1 $ 12,025.1 7.0 100.0 Balance sheet of FDIC-insured commercial banks and savings institutions Note: Column sums may differ from total because of rounding error. Source: Federal Deposit Insurance Corporation, www.fdic.gov, March 2016 a. What is the ratio of real assets to total assets? (Round your answer to 4 decimal places.) Ratio of real estats to total outs b. What is the ratio of real assets to total assets for nonfinancial firms in the following table? (Round your answer to 4 decimal places.) $ Billion total $ Billion Total Assets Real assets Equipment and software Real estate Inventories Total real assets $ 4,362 9,126 1,694 $15,182 16.8 35.0 6.5 58.3 Liabilities and Net Worth Liabilities Bonds and mortgages Bank loans Other loans Trade debt Other Total liabilities $ 5,324 698 1,290 1,690 4,528 $13,530 20.48 2.7 5.0 6.5 17.4 52.0 Pinancial assets Deposito and cash Marketable securities Trade and consumer credit Other Total financial anata Total $ 657 996 2,242 6.961 $10.056 $26,038 2.5. 3.8 8.6 26.7 Net worth 100.0 $12,500 $26,038 48.0 100.0 Balance sheet of U.S. nonfinancial corporations Note: Column sums may differ from total because of rounding error. Source: Flow of Funds Accounts of the United States, Board of Governors of the Federal Reserve System, March 2016 Rabo for nonfinancial firms