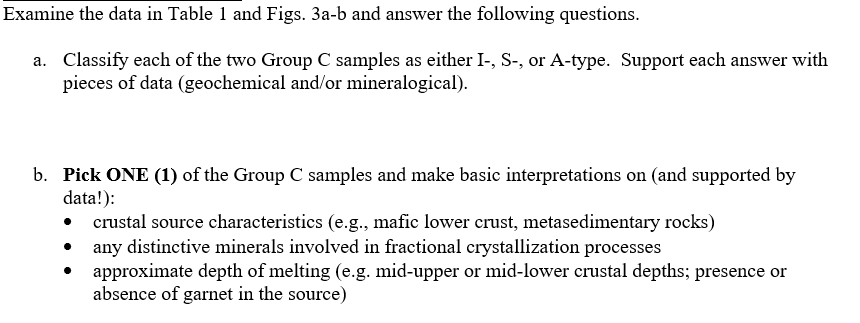
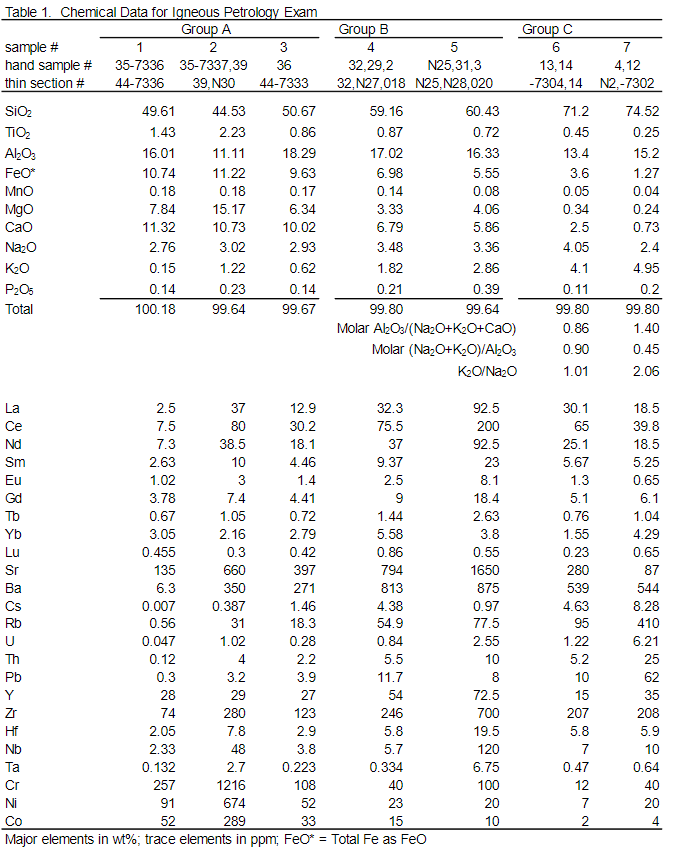
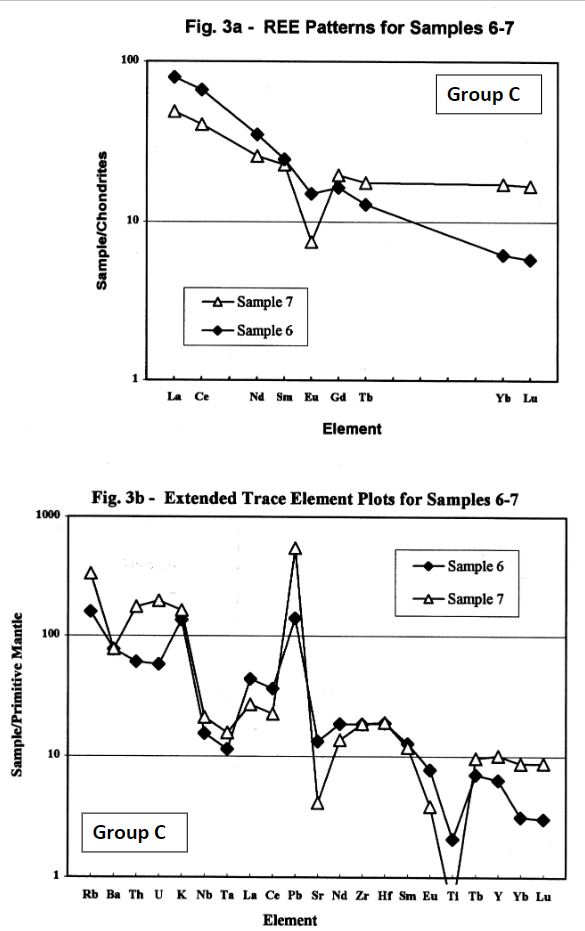
Examine the data in Table 1 and Figs. 3a-b and answer the following questions. a. Classify each of the two Group C samples as either I-, S-, or A-type. Support each answer with pieces of data (geochemical and/or mineralogical). b. Pick ONE (1) of the Group C samples and make basic interpretations on (and supported by data!): crustal source characteristics (e.g., mafic lower crust, metasedimentary rocks) any distinctive minerals involved in fractional crystallization processes approximate depth of melting (e.g. mid-upper or mid-lower crustal depths; presence or absence of garnet in the source) Table 1. Chemical Data for Igneous Petrology Exam Group A sample # 1 2 3 hand sample # 35-7336 35-7337,39 36 thin section # 44-7336 39, N30 44-7333 SIO2 49.61 44.53 50.67 TIO 1.43 2.23 0.86 Al2O3 16.01 11.11 18.29 Feo* 10.74 11.22 9.63 Mno 0.18 0.18 0.17 Mgo 7.84 15.17 6.34 Cao 11.32 10.73 10.02 Nazo 2.76 3.02 2.93 0.15 1.22 0.62 P2O5 0.14 0.23 0.14 Total 100.18 99.64 99.67 Group B Group C 4 5 6 7 32,29,2 N25,31,3 13,14 4,12 32,N27,018 N25, N28,020 -7304, 14 N2,-7302 59.16 60.43 71.2 74.52 0.87 0.72 0.45 0.25 17.02 16.33 13.4 15.2 6.98 5.55 3.6 1.27 0.14 0.08 0.05 0.04 3.33 4.06 0.34 0.24 6.79 5.86 2.5 0.73 3.48 3.36 4.05 2.4 1.82 2.86 4.1 4.95 0.21 0.39 0.11 0.2 99.80 99.64 99.80 99.80 Molar Al2O3/(Na2O+K2O+CaO) 0.86 1.40 Molar (Na2O+KO)/Al2O3 0.90 0.45 KO/Nazo 1.01 2.06 Nd 0.3 2.5 37 12.9 32.3 7.5 80 30.2 75.5 7.3 38.5 18.1 37 Sm 2.63 10 4.46 9.37 Eu 1.02 3 1.4 2.5 Gd 3.78 7.4 4.41 9 Tb 0.67 1.05 0.72 1.44 3.05 2.16 2.79 5.58 0.455 0.42 0.86 135 660 397 794 Ba 6.3 350 271 813 0.007 0.387 1.46 4.38 0.56 31 18.3 54.9 0.047 1.02 0.28 0.84 0.12 4 2.2 5.5 0.3 3.2 3.9 11.7 Y 28 29 27 54 74 280 123 246 2.05 7.8 2.9 5.8 2.33 48 3.8 5.7 0.132 2.7 0.223 0.334 257 1216 108 40 91 674 52 23 52 289 33 15 Major elements in wt%; trace elements in ppm; Feo* = Total Fe as Feo 9828 23 38 D F & AI2 Co z 8 92.5 200 92.5 23 8.1 18.4 2.63 3.8 0.55 1650 875 0.97 77.5 2.55 10 8 72.5 700 19.5 120 6.75 100 20 10 30.1 65 25.1 5.67 1.3 5.1 0.76 1.55 0.23 280 539 4.63 95 1.22 5.2 10 15 207 5.8 7 0.47 12 7 2 18.5 39.8 18.5 5.25 0.65 6.1 1.04 4.29 0.65 87 544 8.28 410 6.21 25 62 35 208 5.9 10 0.64 40 20 4 Fig. 3a - REE Patterns for Samples 6-7 100 Group C Sample/Chondrites 10 Sample 7 -Sample 6 La Ce Yb Lu Nd Sm Eu Gd Tb Element Fig. 3b - Extended Trace Element Plots for Samples 6-7 1000 Sample 6 Sample 7 100 Sample/Primitive Mantle 10 A Group C Rb Ba Th U K Nb Ta La Ce Pb Sr Nd Zr Hf Sm Eu TI Tb Y Yb Lu Element Examine the data in Table 1 and Figs. 3a-b and answer the following questions. a. Classify each of the two Group C samples as either I-, S-, or A-type. Support each answer with pieces of data (geochemical and/or mineralogical). b. Pick ONE (1) of the Group C samples and make basic interpretations on (and supported by data!): crustal source characteristics (e.g., mafic lower crust, metasedimentary rocks) any distinctive minerals involved in fractional crystallization processes approximate depth of melting (e.g. mid-upper or mid-lower crustal depths; presence or absence of garnet in the source) Table 1. Chemical Data for Igneous Petrology Exam Group A sample # 1 2 3 hand sample # 35-7336 35-7337,39 36 thin section # 44-7336 39, N30 44-7333 SIO2 49.61 44.53 50.67 TIO 1.43 2.23 0.86 Al2O3 16.01 11.11 18.29 Feo* 10.74 11.22 9.63 Mno 0.18 0.18 0.17 Mgo 7.84 15.17 6.34 Cao 11.32 10.73 10.02 Nazo 2.76 3.02 2.93 0.15 1.22 0.62 P2O5 0.14 0.23 0.14 Total 100.18 99.64 99.67 Group B Group C 4 5 6 7 32,29,2 N25,31,3 13,14 4,12 32,N27,018 N25, N28,020 -7304, 14 N2,-7302 59.16 60.43 71.2 74.52 0.87 0.72 0.45 0.25 17.02 16.33 13.4 15.2 6.98 5.55 3.6 1.27 0.14 0.08 0.05 0.04 3.33 4.06 0.34 0.24 6.79 5.86 2.5 0.73 3.48 3.36 4.05 2.4 1.82 2.86 4.1 4.95 0.21 0.39 0.11 0.2 99.80 99.64 99.80 99.80 Molar Al2O3/(Na2O+K2O+CaO) 0.86 1.40 Molar (Na2O+KO)/Al2O3 0.90 0.45 KO/Nazo 1.01 2.06 Nd 0.3 2.5 37 12.9 32.3 7.5 80 30.2 75.5 7.3 38.5 18.1 37 Sm 2.63 10 4.46 9.37 Eu 1.02 3 1.4 2.5 Gd 3.78 7.4 4.41 9 Tb 0.67 1.05 0.72 1.44 3.05 2.16 2.79 5.58 0.455 0.42 0.86 135 660 397 794 Ba 6.3 350 271 813 0.007 0.387 1.46 4.38 0.56 31 18.3 54.9 0.047 1.02 0.28 0.84 0.12 4 2.2 5.5 0.3 3.2 3.9 11.7 Y 28 29 27 54 74 280 123 246 2.05 7.8 2.9 5.8 2.33 48 3.8 5.7 0.132 2.7 0.223 0.334 257 1216 108 40 91 674 52 23 52 289 33 15 Major elements in wt%; trace elements in ppm; Feo* = Total Fe as Feo 9828 23 38 D F & AI2 Co z 8 92.5 200 92.5 23 8.1 18.4 2.63 3.8 0.55 1650 875 0.97 77.5 2.55 10 8 72.5 700 19.5 120 6.75 100 20 10 30.1 65 25.1 5.67 1.3 5.1 0.76 1.55 0.23 280 539 4.63 95 1.22 5.2 10 15 207 5.8 7 0.47 12 7 2 18.5 39.8 18.5 5.25 0.65 6.1 1.04 4.29 0.65 87 544 8.28 410 6.21 25 62 35 208 5.9 10 0.64 40 20 4 Fig. 3a - REE Patterns for Samples 6-7 100 Group C Sample/Chondrites 10 Sample 7 -Sample 6 La Ce Yb Lu Nd Sm Eu Gd Tb Element Fig. 3b - Extended Trace Element Plots for Samples 6-7 1000 Sample 6 Sample 7 100 Sample/Primitive Mantle 10 A Group C Rb Ba Th U K Nb Ta La Ce Pb Sr Nd Zr Hf Sm Eu TI Tb Y Yb Lu Element