Answered step by step
Verified Expert Solution
Question
1 Approved Answer
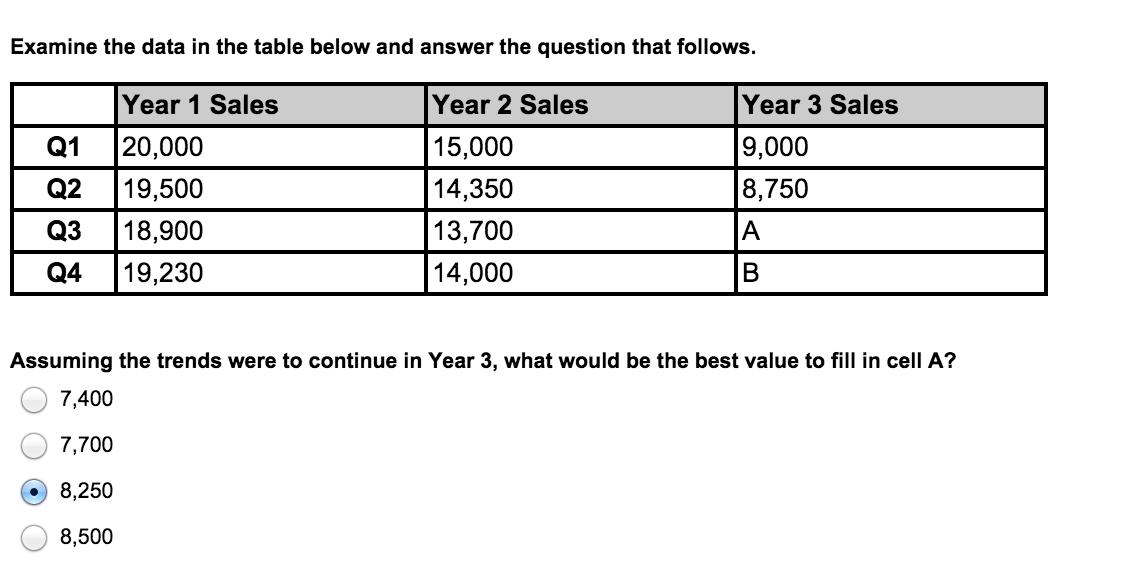
Examine the data in the table below and answer the question that follows. Year 1 Sales Year 2 Sales Q1 20,000 15,000 Q2 19,500

Examine the data in the table below and answer the question that follows. Year 1 Sales Year 2 Sales Q1 20,000 15,000 Q2 19,500 14,350 Q3 18,900 13,700 Q4 19,230 14,000 Year 3 Sales 9,000 8,750 O A B Assuming the trends were to continue in Year 3, what would be the best value to fill in cell A? 7,400 7,700 8,250 8,500 Examine the data in the table below and answer the question that follows. Year 1 Sales Year 2 Sales Q1 20,000 15,000 Q2 19,500 14,350 Q3 18,900 13,700 Q4 19,230 14,000 Year 3 Sales 9,000 8,750 O A B Assuming the trends were to continue in Year 3, what would be the best value to fill in cell A? 7,400 7,700 8,250 8,500
Step by Step Solution
There are 3 Steps involved in it
Step: 1
The detailed answer for the above question is provided below SOLUTION To determine the best value to ...
Get Instant Access to Expert-Tailored Solutions
See step-by-step solutions with expert insights and AI powered tools for academic success
Step: 2

Step: 3

Ace Your Homework with AI
Get the answers you need in no time with our AI-driven, step-by-step assistance
Get Started


