Answered step by step
Verified Expert Solution
Link Copied!

Question

1 Approved Answer

Examine the following bar graph that shows budgeted monthly util ity expenses for a one-year period. Utility Budget 900 10 Budgeted Amount 6ool 400 UPD
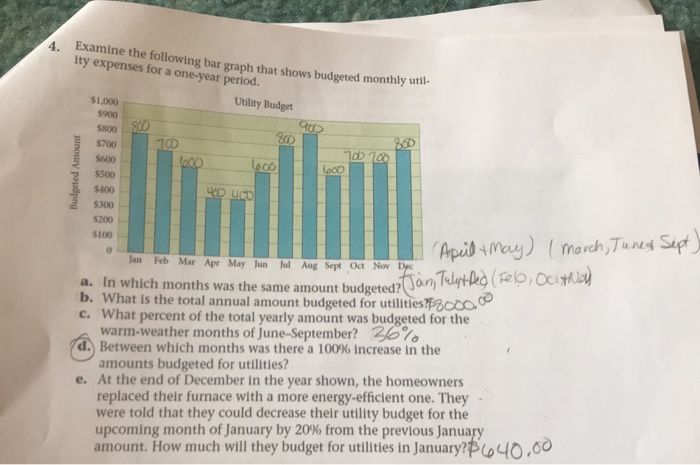
image text in transcribed
Examine the following bar graph that shows budgeted monthly util ity expenses for a one-year period. Utility Budget 900 10 Budgeted Amount 6ool 400 UPD $1,000 5900 $800 SUD $700 5600 100 100 $500 COD $400 $300 $200 5100 April May) I march, Tuned Sept) Jan Feb Mar Apr May Jun Jul Aug Sep Oct Nov Dec hs was the same amount budgeted: Jan Telyt Des (Felo. Ocito b. What is the total annual amount budgeted for utilities?8000 c. What percent of the total yearly amount was budgeted for the warm-weather months of June-September? 26% d. Between which months was there a 100% increase in the amounts budgeted for utilities? At the end of December in the year shown, the homeowners replaced their furnace with a more energy-efficient one. They were told that they could decrease their utility budget for the upcoming month of January by 20% from the previous January amount. How much will they budget for utilities in January?p640,00

Step by Step Solution

There are 3 Steps involved in it

Step: 1

blur-text-image

Get Instant Access to Expert-Tailored Solutions

See step-by-step solutions with expert insights and AI powered tools for academic success

Step: 2

blur-text-image

Step: 3

blur-text-image

Ace Your Homework with AI

Get the answers you need in no time with our AI-driven, step-by-step assistance

Get Started

Recommended Textbook for

Accounting And Financial Analysis In The Hospitality Industry

Authors: Jonathan A. Hales

1st Edition

0750678968, 978-0750678964

More Books

Students also viewed these Accounting questions

Question

=+2 Is the decision sustainable in the long run?

Answered: 1 week ago

Question

=+1 Is the decision fair to employees?

Answered: 1 week ago