

Question
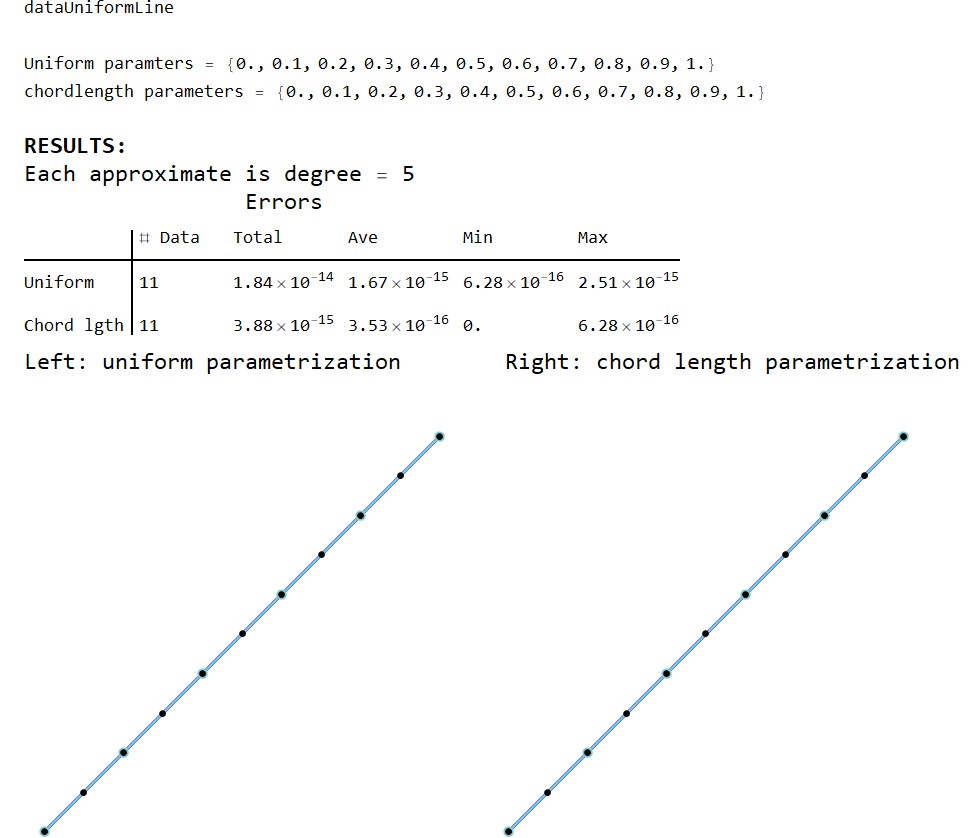
Examine the graphics display and errors for the approximations.The sampled data is of a uniformly sampled line. Comment on the behavior of the approximation based
Examine the graphics display and errors for the approximations.The sampled data is of a uniformly sampled line.
Comment on the behavior of the approximation based on the degree and parameters. Anything interesting/special?
Share any general observations regarding the two parameter generation methods and the approximation degree.
Step by Step Solution
There are 3 Steps involved in it
Step: 1

Get Instant Access to Expert-Tailored Solutions
See step-by-step solutions with expert insights and AI powered tools for academic success
Step: 2

Step: 3
Ace Your Homework with AI
Get the answers you need in no time with our AI-driven, step-by-step assistance
Get Started
Probability and Random Processes With Applications to Signal Processing and Communications
Authors: Scott Miller, Donald Childers
2nd edition
123869811, 978-0121726515, 121726517, 978-0130200716, 978-0123869814