

Question
Examine the hospitals statement of cash flows. What information do they provide regarding the hospitals sources and uses of cash over the past two years?
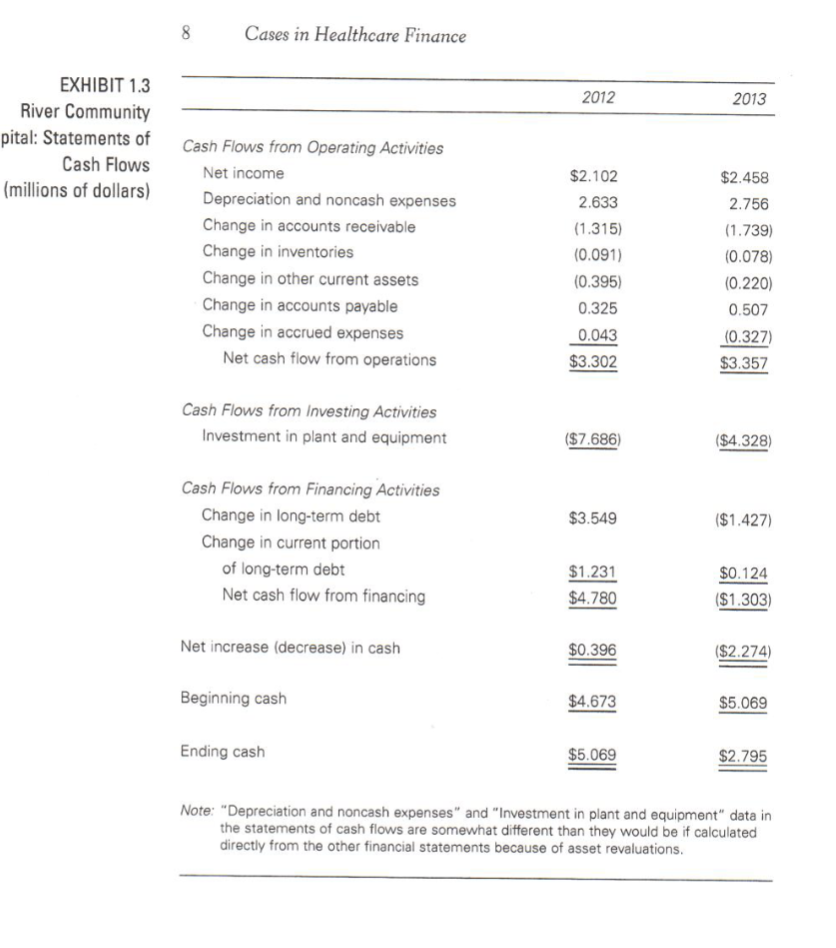
Examine the hospitals statement of cash flows. What information do they provide regarding the hospitals sources and uses of cash over the past two years? 2. List five or more financial strengths of the hospital? (Hint: Do not provide a list of ratios. Make a statement and then justify it with information from the financial statements and ratios.) 3. List five or more financial weaknesses of the hospital? (Hint: Do not provide a list of ratios. Make a statement and then justify it with information from the financial statements and ratios.) 4. The Board chair has asked management to develop some strategies to improve profitability and estimate the impact of the strategies on the hospitals ROE. By how much would the 2013 ROE change from each of these strategies? a. Vacant land is sold and total assets decreases by $2.0 million. Net income would not be affected and the Board wants to maintain the 2013 debt ratio. b. Debt is substituted for equity and the debt ratio increases to 48 percent. Total assets would not be affected. Interest expense would increase but better cost controls would offset the higher interest expense and thus net income would not change. c. LEAN management is implemented and total expenses decrease by $0.5 million. Total revenue, total assets, and total liabilities & net assets would not change. d. Whatever strategy Melissa chooses, she is under pressure from the Board to increase return on equity to at least 10 percent. What total margin would be needed to achieve the 10% ROE, holding everything else constant?
5. What additional financial information would be useful in the analysis?
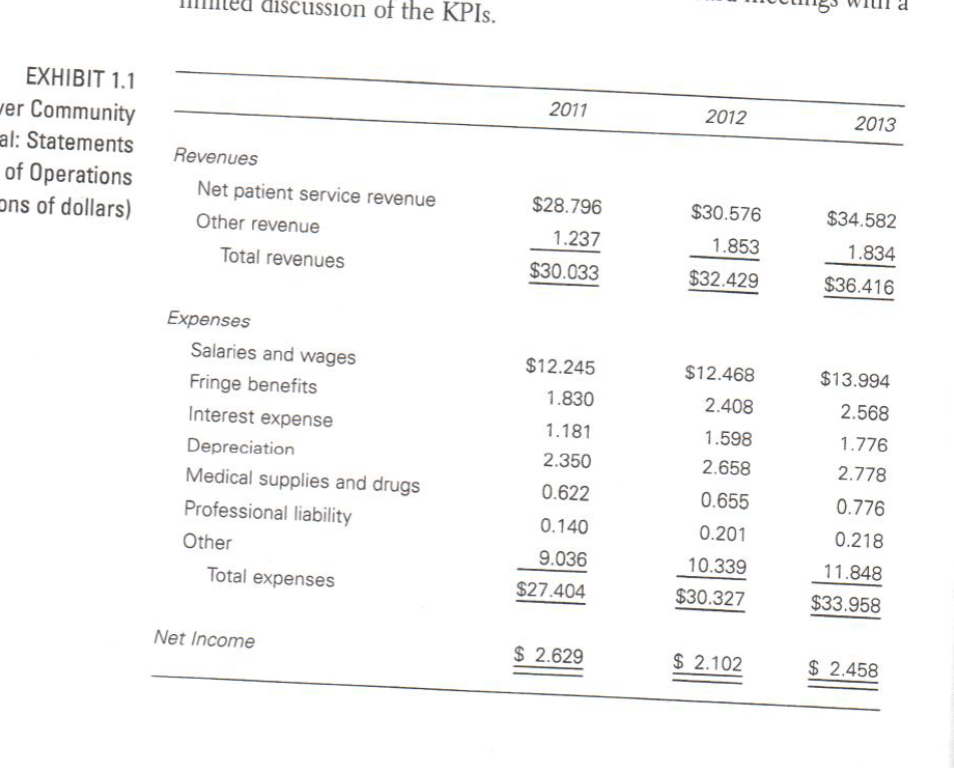
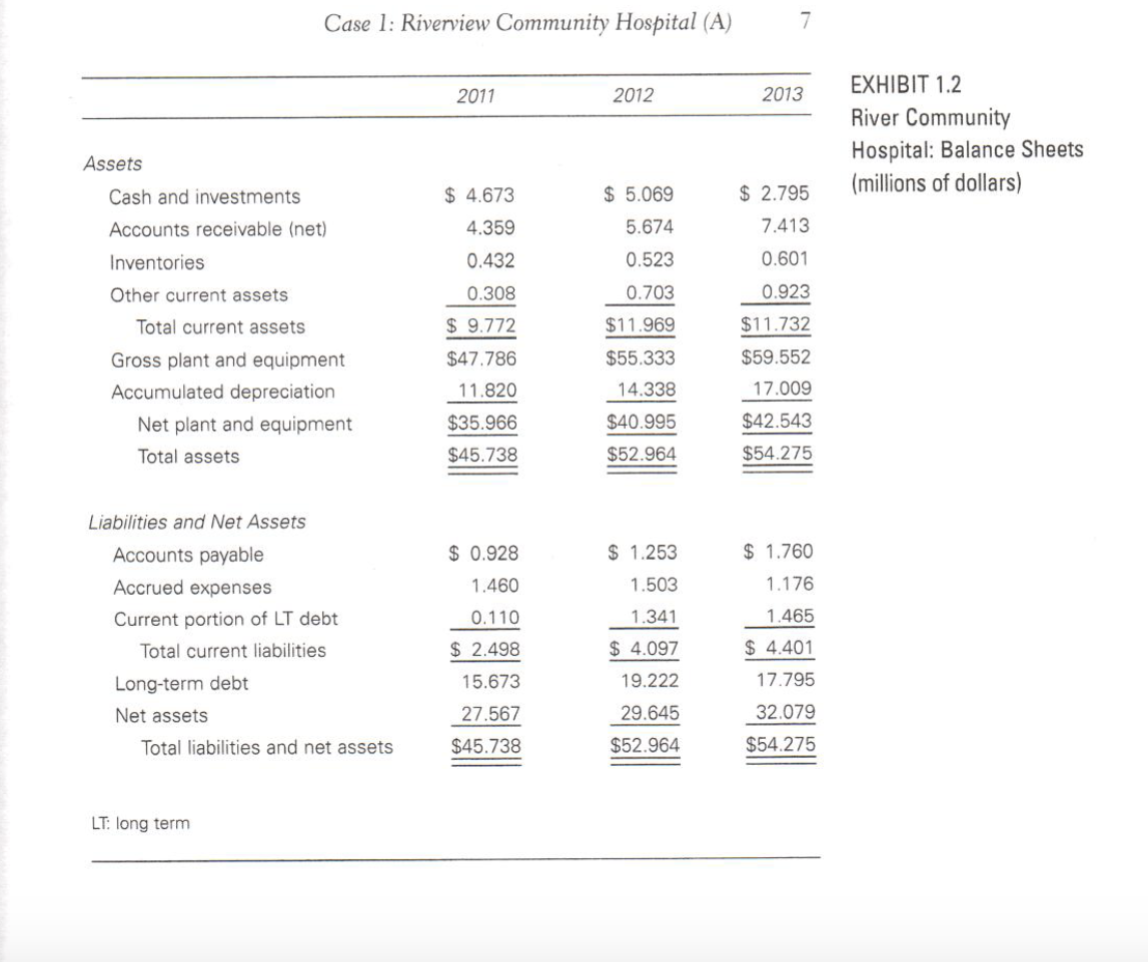
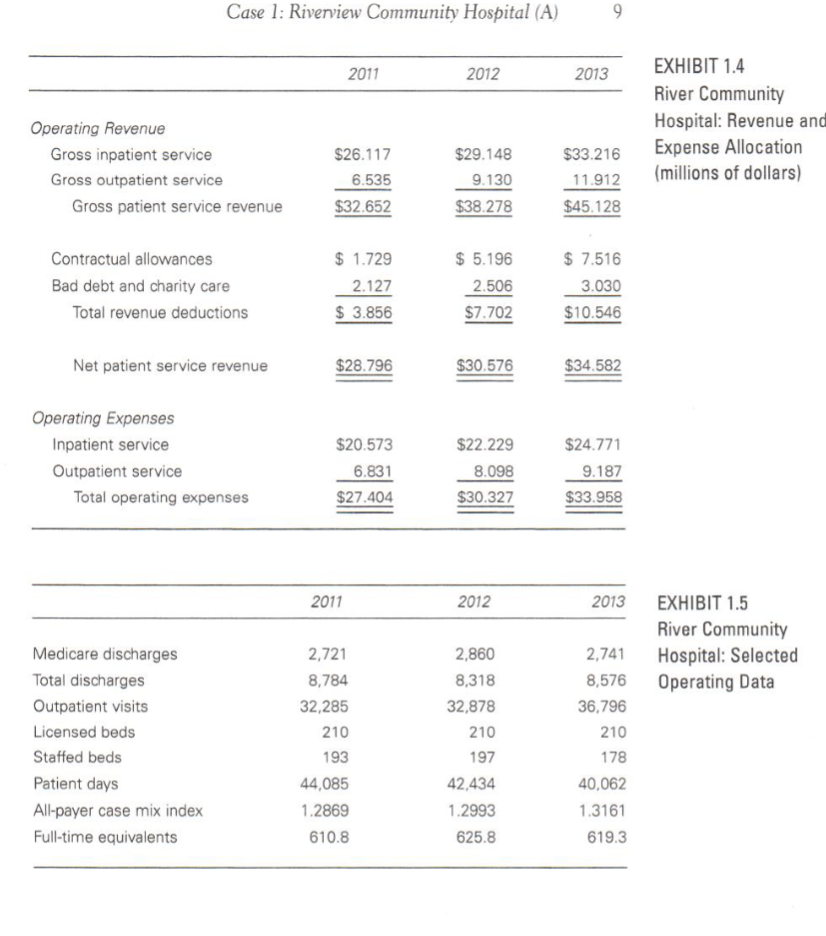
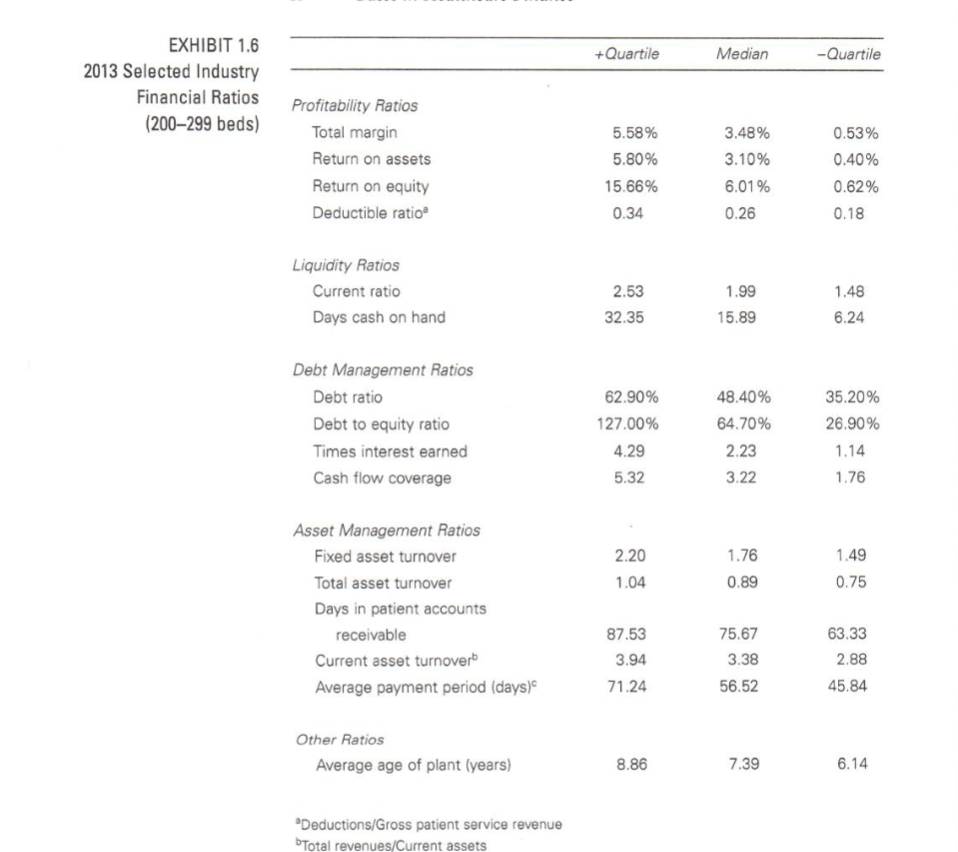
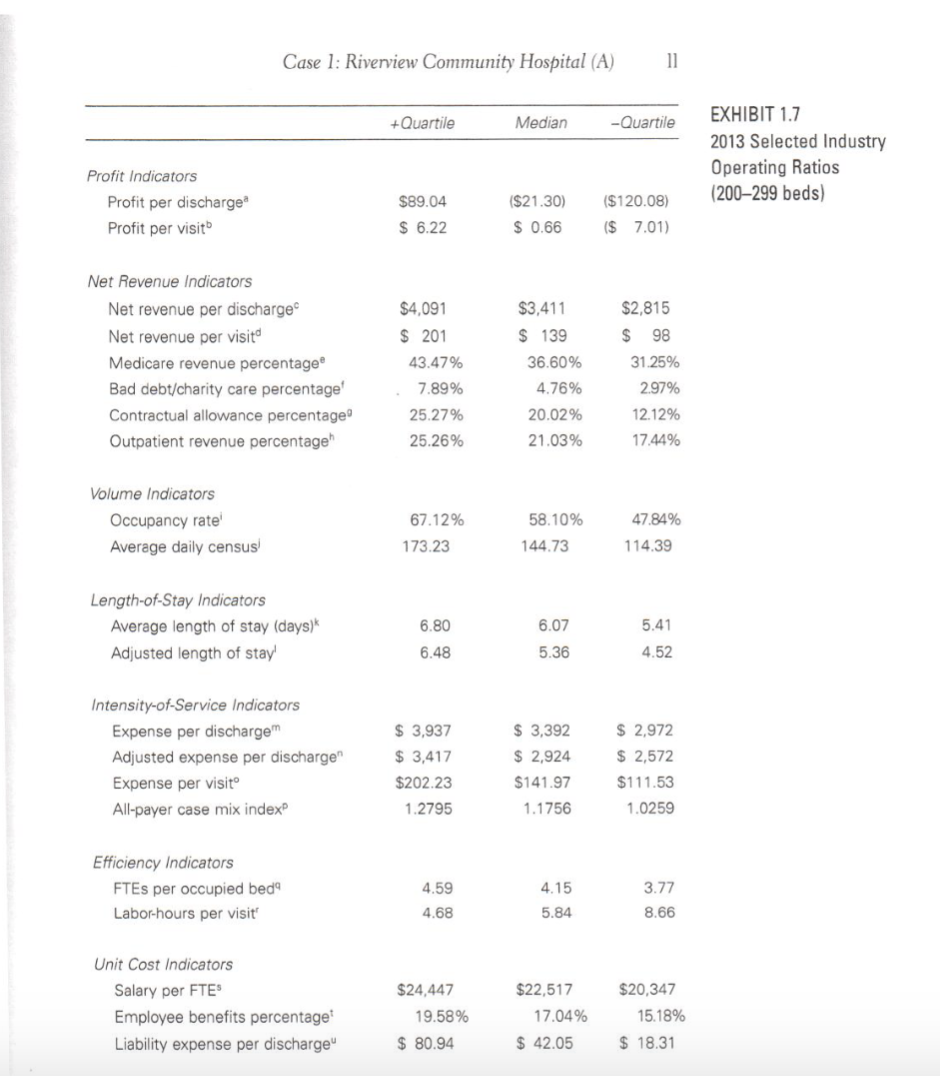
discussion of the KPIs. 2011 2012 2013 EXHIBIT 1.1 wer Community al: Statements of Operations Ons of dollars) Revenues Net patient service revenue Other revenue Total revenues $28.796 1.237 $30.033 $30.576 1.853 $34.582 1.834 $32.429 $36.416 $12.245 1.830 $13.994 $12.468 2.408 2.568 Expenses Salaries and wages Fringe benefits Interest expense Depreciation Medical supplies and drugs Professional liability Other Total expenses 1.181 2.350 0.622 1.598 2.658 1.776 2.778 0.140 9.036 0.655 0.201 10.339 $30.327 0.776 0.218 11.848 $33.958 $27.404 Net Income $ 2.629 $ 2.102 $ 2.458 Case 1: Riverview Community Hospital (A) 7 2011 2012 2013 EXHIBIT 1.2 River Community Hospital: Balance Sheets (millions of dollars) Assets $ 5.069 $ 2.795 7.413 5.674 0.523 0.601 0.703 0.923 Cash and investments Accounts receivable (net) Inventories Other current assets Total current assets Gross plant and equipment Accumulated depreciation Net plant and equipment Total assets $ 4.673 4.359 0.432 0.308 $ 9.772 $47.786 11.820 $35.966 $45.738 $11.969 $55.333 14.338 $40.995 $52.964 $11.732 $59.552 17.009 $42.543 $54.275 $ 0.928 $ 1.253 $ 1.760 1.503 1.176 1.465 Liabilities and Net Assets Accounts payable Accrued expenses Current portion of LT debt Total current liabilities Long-term debt Net assets Total liabilities and net assets 1.460 0.110 $ 2.498 15.673 1.341 $ 4.097 $ 4.401 17.795 19.222 29.645 $52.964 27.567 $45.738 32.079 $54.275 LT: long term 8 Cases in Healthcare Finance 2012 2013 EXHIBIT 1.3 River Community pital: Statements of Cash Flows (millions of dollars) Cash Flows from Operating Activities Net income Depreciation and noncash expenses Change in accounts receivable Change in inventories Change in other current assets Change in accounts payable Change in accrued expenses Net cash flow from operations $2.102 2.633 (1.315) (0.091) (0.395) 0.325 0.043 $3.302 $2.458 2.756 (1.739) (0.078) (0.220) 0.507 (0.327) $3.357 Cash Flows from Investing Activities Investment in plant and equipment ($7.686 ($4.328) $3.549 ($1.427) Cash Flows from Financing Activities Change in long-term debt Change in current portion of long-term debt Net cash flow from financing $1.231 $4.780 $0.124 ($1.303) Net increase (decrease) in cash $0.396 ($2.274) Beginning cash $4.673 $5.069 Ending cash $5.069 $2.795 Note: "Depreciation and noncash expenses" and "Investment in plant and equipment" data in the statements of cash flows are somewhat different than they would be if calculated directly from the other financial statements because of asset revaluations. Case 1: Riverview Community Hospital (A) 9 2011 2012 2013 Operating Revenue Gross inpatient service Gross outpatient service Gross patient service revenue EXHIBIT 1.4 River Community Hospital: Revenue and Expense Allocation (millions of dollars) $26.117 6.535 $32.652 $29.148 9.130 $38.278 $33.216 11.912 $45.128 Contractual allowances Bad debt and charity care Total revenue deductions $ 1.729 2.127 $ 3.856 $ 5.196 2.506 $7.702 $ 7.516 3.030 $10.546 Net patient service revenue $28.796 $30.576 $34.582 Operating Expenses Inpatient service Outpatient service Total operating expenses $20.573 6.831 $27,404 $22.229 8.098 $30.327 $24.771 9.187 $33.958 2011 2012 2013 EXHIBIT 1.5 River Community Hospital: Selected Operating Data Medicare discharges Total discharges Outpatient visits Licensed beds Staffed beds Patient days All-payer case mix index Full-time equivalents 2,721 8,784 32,285 210 193 44,085 1.2869 610.8 2,860 8,318 32,878 210 197 42,434 1.2993 625.8 2,741 8,576 36,796 210 178 40,062 1.3161 619.3 +Quartile Median -Quartile EXHIBIT 1.6 2013 Selected Industry Financial Ratios (200-299 beds) Profitability Ratios Total margin Return on assets Return on equity Deductible ratio 5.58% 5.80% 15.66% 0.34 3.48% 3.10% 6.01% 0.26 0.53% 0.40% 0.62% 0.18 Liquidity Ratios Current ratio Days cash on hand 2.53 32.35 1.99 15.89 1.48 6.24 Debt Management Ratios Debt ratio Debt to equity ratio Times interest earned Cash flow coverage 62.90% 127.00% 4.29 5.32 48.40% 64.70% 2.23 3.22 35.20% 26.90% 1.14 1.76 2.20 1.04 1.76 0.89 1.49 0.75 Asset Management Ratios Fixed asset turnover Total asset turnover Days in patient accounts receivable Current asset turnoverb Average payment period (days) 87.53 3.94 71.24 75.67 3.38 56.52 63.33 2.88 45.84 Other Ratios Average age of plant (years) 8.86 7.39 6.14 Deductions/Gross patient service revenue Total revenues/Current assets Case 1: Riverview Community Hospital (A) 11 +Quartile Median -Quartile EXHIBIT 1.7 2013 Selected Industry Operating Ratios (200-299 beds) Profit Indicators Profit per discharge Profit per visit $89.04 $ 6.22 ($21.30) $ 0.66 ($120.08) ($ 7.01) $2,815 $ 98 Net Revenue Indicators Net revenue per discharge Net revenue per visitd Medicare revenue percentage Bad debt/charity care percentage Contractual allowance percentage Outpatient revenue percentage $4,091 $ 201 43.47% 7.89% 25.27% 25.26% $3,411 $ 139 36.60% 4.76% 20.02% 31.25% 2.97% 12.12% 17.44% 21.03% Volume Indicators Occupancy rate Average daily census 47.84% 67.12% 173.23 58.10% 144.73 114.39 Length-of-Stay Indicators Average length of stay (days) Adjusted length of stay! 6.80 6.07 5.41 6.48 5.36 4.52 Intensity-of-Service Indicators Expense per dischargem Adjusted expense per discharge Expense per visit All-payer case mix index $ 3,937 $ 3,417 $202.23 1.2795 $ 3,392 $ 2,924 $141.97 1.1756 $ 2,972 $ 2,572 $111.53 1.0259 Efficiency Indicators FTEs per occupied bed Labor-hours per visit 4.59 4.15 5.84 3.77 8.66 4.68 Unit Cost Indicators Salary per FTES Employee benefits percentage Liability expense per discharge $24,447 19.58% $ 80.94 $22,517 17.04% $ 42.05 $20,347 15.18% $ 18.31Step by Step Solution
There are 3 Steps involved in it
Step: 1

Get Instant Access to Expert-Tailored Solutions
See step-by-step solutions with expert insights and AI powered tools for academic success
Step: 2

Step: 3
Ace Your Homework with AI
Get the answers you need in no time with our AI-driven, step-by-step assistance
Get Started
Options Trading For Beginners How To Generate Predictable Income And Make A Living Without Taking Big Risks Even If You Re A Complete Beginner
Authors: Greg Middleton
1st Edition
979-8866955046