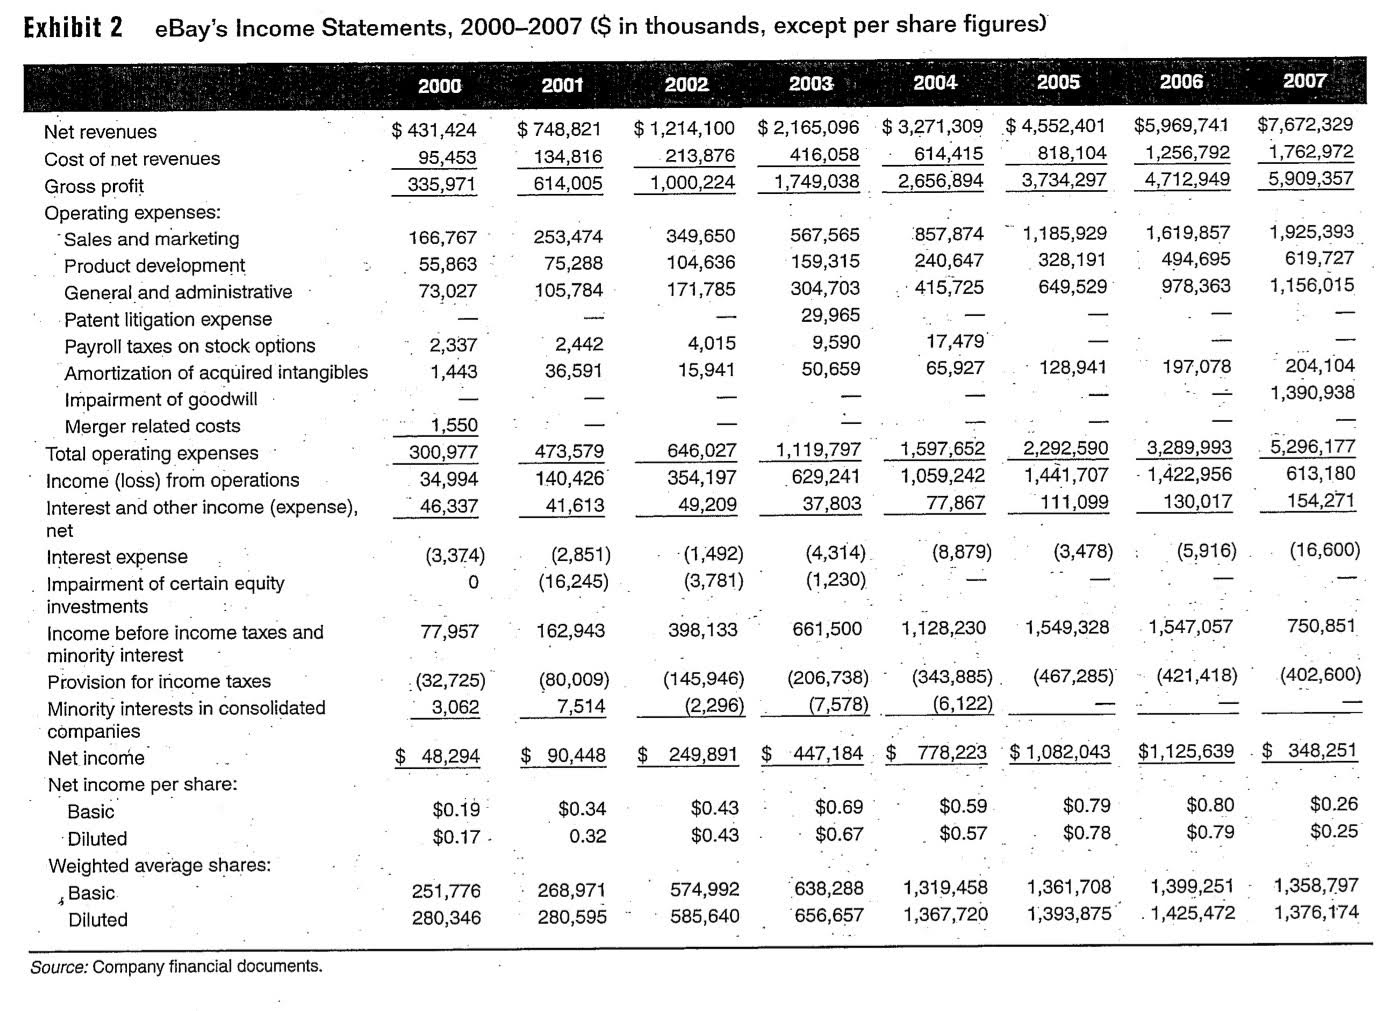
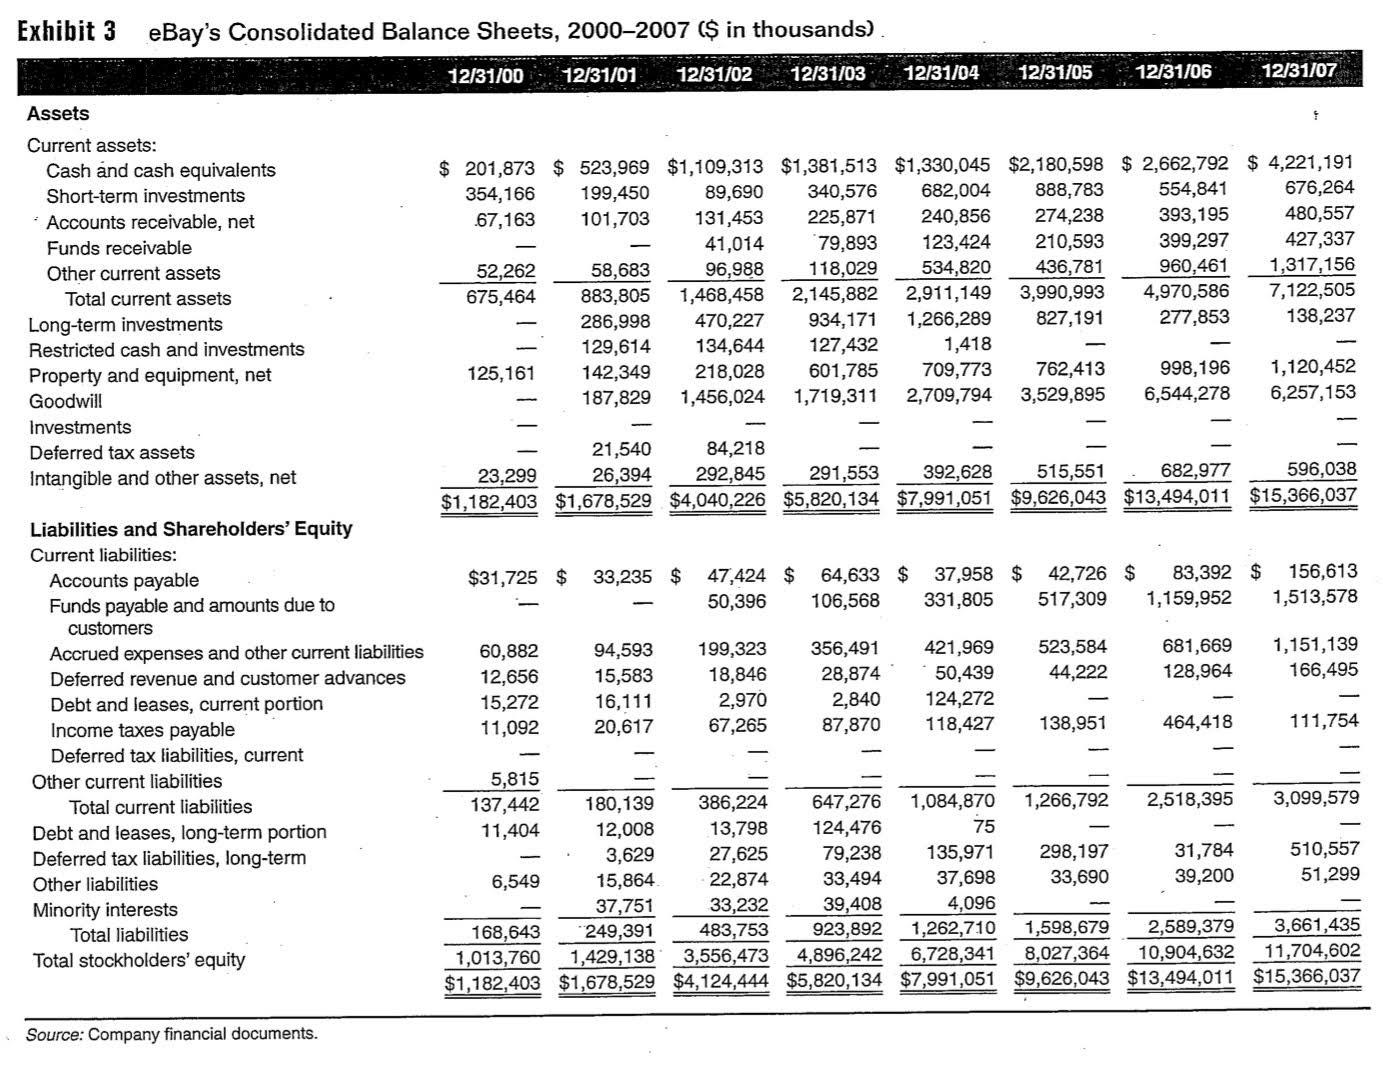
Examine the Indicators of eBay growth since 2000 (Exhibit 1), as well as Exhibits 2, and 3.Which economic conditions (within the eCommerce industry and overall Online consumerism as a whole) may have influenced eBay's rate of growth?Be specific and describe the impact of each event.Provide examples, and justify each statement.
Exhibit 1 Selected Indicators of eBay's Growth, 1998-2007 (all figures are in millions) 2008 Partial 2000 2001 2002 2003 2004 2005 2006 2007 Yeart Registered users 22.0 42.4 61.7 94.9 135.5 180.6 221.6 276.3 370.2 Active users* NA 18.0 27.7 41.2 56.1 71.8 81.8 83.2 85.7 Gross merchandise sales $5,400 $9,300 $14,900 $24,000 $34,200 $44,299 $52,474 $59,353 $46,004 Number of auctions listed 264 423 638 971 1,412.6 1,876.8 2,365.3 2,340.5 2,015 *Defined as a user who has bid on, bought, or listed an item during the most recent 12-month period. ITotals as of September 30, 2008, based on third-quarter results, as posted in third-quarter report.Exhibit 2 eBay's Income Statements, 2000-2007 ($ in thousands, except per share figures) 2000 2001 2002 2003 2004 2005 2006 2007 Net revenues $ 431,424 $ 748,821 $ 1,214,100 $ 2,165,096 $ 3,271,309 $ 4,552,401 $5,969,741 $7,672,329 Cost of net revenues 95,453 134,816 213,876 416,058 614,415 818,104 1,256,792 1,762,972 Gross profit 335,971 614,005 1,000,224 1,749,038 2,656,894 3,734,297 4,712,949 5,909,357 Operating expenses: Sales and marketing 166,767 253,474 349,650 567,565 :857,874 1,185,929 1,619,857 1,925,393 Product development 55,863 75,288 104,636 159,315 240,647 328, 191 494,695 619,727 General and administrative 73,027 105,784 171,785 304,703 : ' 415,725 649,529 978,363 1,156,015 Patent litigation expense 29,965 Payroll taxes on stock options 2,337 2,442 4,015 9,590 17,479 Amortization of acquired intangibles 1,443 36,591 15,941 50,659 65,927 128,941 197,078 204, 104 Impairment of goodwill 1,390,938 Merger related costs 1,550 Total operating expenses 300,977 473,579 646,027 1, 119,797 1,597,652 2,292,590 3,289,993 5,296, 177 Income (loss) from operations 34,994 140,426 354,197 629,241 1,059,242 1,441,707 1,422,956 613, 180 Interest and other income (expense), 46,337 41,613 49,209 37,803 77,867 111,099 130,017 154,271 net Interest expense (3,374) (2,851) (1,492) (4,314) (8,879) (3,478) (5,916) .(16,600) Impairment of certain equity (16,245) (3,781) (1,230) investments Income before income taxes and 77,957 162,943 398,133 661,500 1,128,230 1,549,328 . 1,547,057 750,851 minority interest Provision for income taxes (32,725) (80,009) (145,946) (206,738) - (343,885) . (467,285) -(421,418) (402,600) Minority interests in consolidated 3,062 7,514 (2,296) (7,578) (6,122) companies Net income $ 48,294 $ 90,448 $ 249,891 447,184 $ 778,223 $ 1,082,043 $1,125,639 . $ 348,251 Net income per share: Basic $0.19 $0.34 $0.43 $0.69 $0.59 $0.79 $0.80 $0.26 Diluted $0.17 - 0.32 $0.43 $0.67 $0.57 $0.78 $0.79 $0.25 Weighted average shares: Basic 251,776 268,971 574,992 638,288 1,319,458 1,361,708 1,399,251 - 1,358,7.97 Diluted 280,346 280,595 585,640 656,657 1,367,720 1,393,875 . 1,425,472 1,376, 174 Source: Company financial documents.Exhibit 3 eBay's Consolidated Balance Sheets, 2000-2007 ($ in thousands). 12/31/00 12/31/01 12/31/02 12/31/03 12/31/04 12/31/05 12/31/06 12/31/07 Assets Current assets: Cash and cash equivalents $ 201,873 $ 523,969 $1,109,313 $1,381,513 $1,330,045 $2,180,598 $ 2,662,792 $ 4,221,191 Short-term investments 354, 166 199,450 89,690 340,576 682,004 888,783 554,841 676,264 Accounts receivable, net 67,163 101,703 131,453 225,871 240,856 274,238 393, 195 480,557 Funds receivable 41,014 79,893 123,424 210,593 399,297 427,337 Other current assets 52,262 58,683 96,988 118,029 534,820 436,781 960,461 1,317,156 Total current assets 675,464 883,805 1,468,458 2,145,882 2,911,149 3,990,993 4,970,586 7,122,505 Long-term investments 286,998 470,227 934,171 1,266,289 827,191 277,853 138,237 Restricted cash and investments 129,614 134,644 127,432 1,418 Property and equipment, net 125,161 142,349 218,028 601,785 709,773 762,413 998, 196 1,120,452 Goodwill 187,829 1,456,024 1,719,311 2,709,794 3,529,895 6,544,278 6,257,153 Investments Deferred tax assets 21,540 84,218 Intangible and other assets, net 23,299 26,394 292,845 291,553 392,628 515,551 682,977 596,038 $1,182,403 $1,678,529 $4,040,226 $5,820,134 $7,991,051 $9,626,043 $13,494,011 $15,366,037 Liabilities and Shareholders' Equity Current liabilities: Accounts payable $31,725 $ 33,235 $ 47,424 $ 64,633 $ 37,958 $ 42,726 $ 83,392 $ 156,613 Funds payable and amounts due to 50,396 106,568 331,805 517,309 1,159,952 1,513,578 customers Accrued expenses and other current liabilities 60,882 94,593 199,323 356,491 421,969 523,584 681,669 1,151,139 Deferred revenue and customer advances 12,656 15,583 18,846 28,874 50,439 44,222 128,964 166,495 Debt and leases, current portion 15,272 16,111 2,970 2,840 124,272 Income taxes payable 11,092 20,617 67,265 87,870 118,427 138,951 464,418 111,754 Deferred tax liabilities, current Other current liabilities 5,815 Total current liabilities 137,442 180, 139 386,224 647,276 1,084,870 1,266,792 2,518,395 3,099,579 Debt and leases, long-term portion 11,404 12,008 13,798 124,476 75 Deferred tax liabilities, long-term 3,629 27,625 79,238 135,971 298,197 31,784 510,557 Other liabilities 6,549 15,864 22,874 33,494 37,698 33,690 39,200 51,299 Minority interests 37,751 33,232 39,408 4,096 Total liabilities 168,643 249,391 483,753 923,892 1,262,710 1,598,679 2,589,379 3,661,435 Total stockholders' equity 1,013,760 1,429,138 3,556,473 4,896,242 6,728,341 8,027,364 10,904,632 11,704,602 $1,182,403 $1,678,529 $4, 124,444 $5,820,134 $7,991,051 $9,626,043 $13,494,011 $15,366,037 Source: Company financial documents


