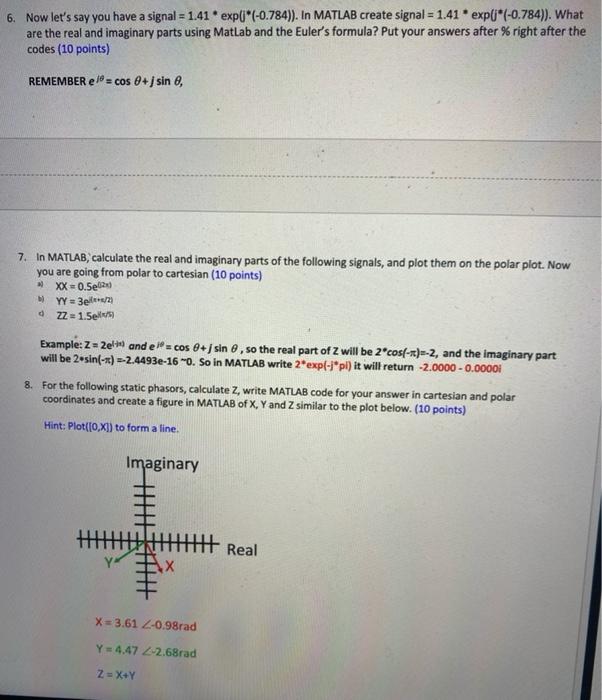
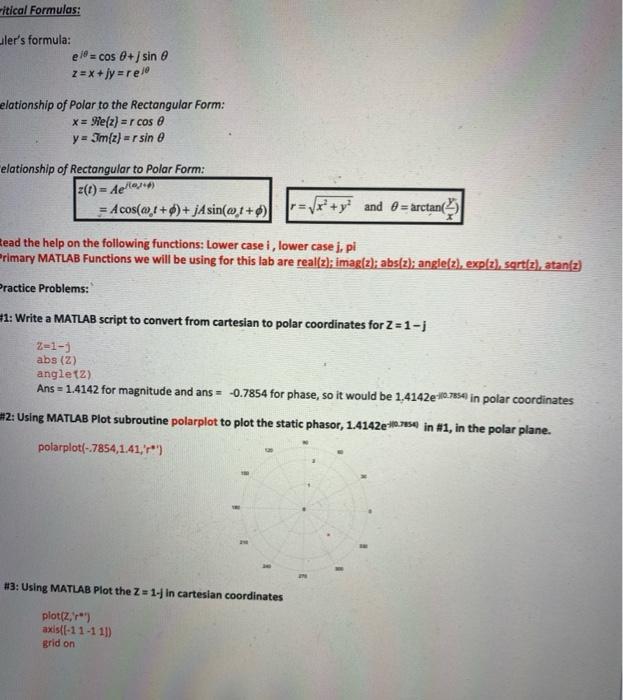
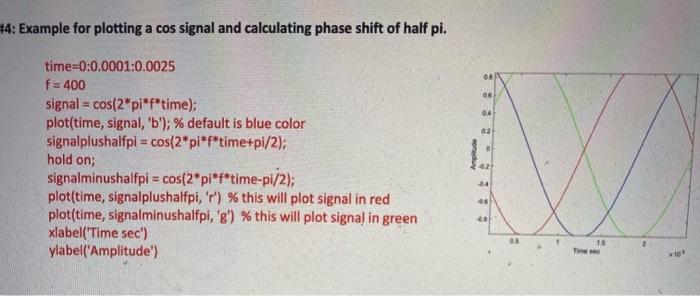
Part 1, Static Phasor (60 points) 1. Write a MATLAB script to convert from cartesian to polar coordinates. Ask the user to enter the real (x) and the imaginary (y) components of Z from keyboard (Z = 1 -j). The static phasor in problems 2-5 will be the user created one in this problem (5 points) Hint: Sample code for part of this problem is provided in Practice #1. 2. Following Problem 1, write MATLAB Code that calculates the magnitude and phase of the input static phasor, by using the mathematical equations shown in class. (5 points) Hint: Use Practice #1 as example, mathematically the magnitude would be sqrt{(1)2+(-1)*)=sqrt(2)-1.4142, and the phase or angle would be arctan(-1/1)=-0.7854 3. Using MATLAB Plot subroutine polarplot to plot in the polar plane: (5 points) Hint: Sample code for part of this problem is provided in Practice #2. 4. Using MATLAB Plot in cartesian coordinates (10 points) Hint: Sample code for part of this problem is provided in Practice #3. 5. Using the hold on commend to add plots in the figure. What are the polar coordinates of Z+X and Z+Y if X=2+3j and Y=2-3j? and plot each on the cartesian and polar plots: (5 points) REMEMBER: when adding signals it is easier to add in cartesian coordinates where you add the real and add the imaginary components so T=Z+X=(1-1)+(2+3]) = 1+2 -1+3) = 3+2) 6. Now lata 6. Now let's say you have a signal = 1.41 *exp(*(-0.784)). In MATLAB create signal = 1.41 *exp*(-0.784)). What are the real and imaginary parts using Matlab and the Euler's formula? Put your answers after % right after the codes (10 points) REMEMBER el= cos 0+ sin , 7. In MATLAB, calculate the real and imaginary parts of the following signals, and plot them on the polar plot. Now you are going from polar to cartesian (10 points) * XX=0.5e62) YY = 3/2 4 ZZ = 1.5e Example: Z = 2elt andel = cos 0+j sin e, so the real part of Z will be 2*cos(-1)=-2, and the imaginary part will be 2.sin(-4) -2.4493e-16 -0. So in MATLAB write 2*exp(-1*pl) it will return -2.0000 - 0.00001 8. For the following static phasors, calculate 2, write MATLAB code for your answer in cartesian and polar coordinates and create a figure in MATLAB of X, Y and Z similar to the plot below. (10 points) Hint: Plot([0.xl) to form a line. Imaginary Real X=3.61 Z-0.98rad Y+4.47 2-2.68rad 2=X+Y Fitical Formulas: Liler's formula: el = cos @+ sin e z = x+y=rel elationship of Polar to the Rectangular Form: x= We(z) = cos e y = Im{z} =r sin elationship of Rectangular to Polar Form: -(1) de = Acos(691+)+jAsin(@t+) =x?+y? and = arctan Read the help on the following functions: Lower case i, lower casej, pi Primary MATLAB Functions we will be using for this lab are real(z); imag(z); abs(z); angie(z), exp(z), sartz), atan(z) Practice Problems: =1: Write a MATLAB script to convert from cartesian to polar coordinates for Z=1-1 2-1-1 abs (2) angletz) Ans = 1.4142 for magnitude and ans = -0.7854 for phase, so it would be 1,4142e-80-7854 in polar coordinates #2: Using MATLAB Plot subroutine polarplot to plot the static phasor, 1.4142e-10.7854) in #1, in the polar plane. polarplot(-.7854,1.41,'*') #3: Using MATLAB Plot the Z=14 in cartesian coordinates plot(2,*') axist[-11-111) grid on #4: Example for plotting a cos signal and calculating phase shift of half pi. 00 time=0:0.0001:0.0025 f = 400 signal = cos(2pi*f*time); plot(time, signal, 'b'); % default is blue color signalplushalfpi = cos(2pi"f"time+pi/2); 04 02 0 hold on Arou 62 14 signalminushalfpi = cos(2*pi*f*time-pi/2); plot(time, signalplushalfpi, 'Y') % this will plot signal in red plot(time, signalminushalfpi, '8') % this will plot signa) in green xlabel('Time sec') ylabel('Amplitude') 00 15 To