Answered step by step
Verified Expert Solution
Question
1 Approved Answer
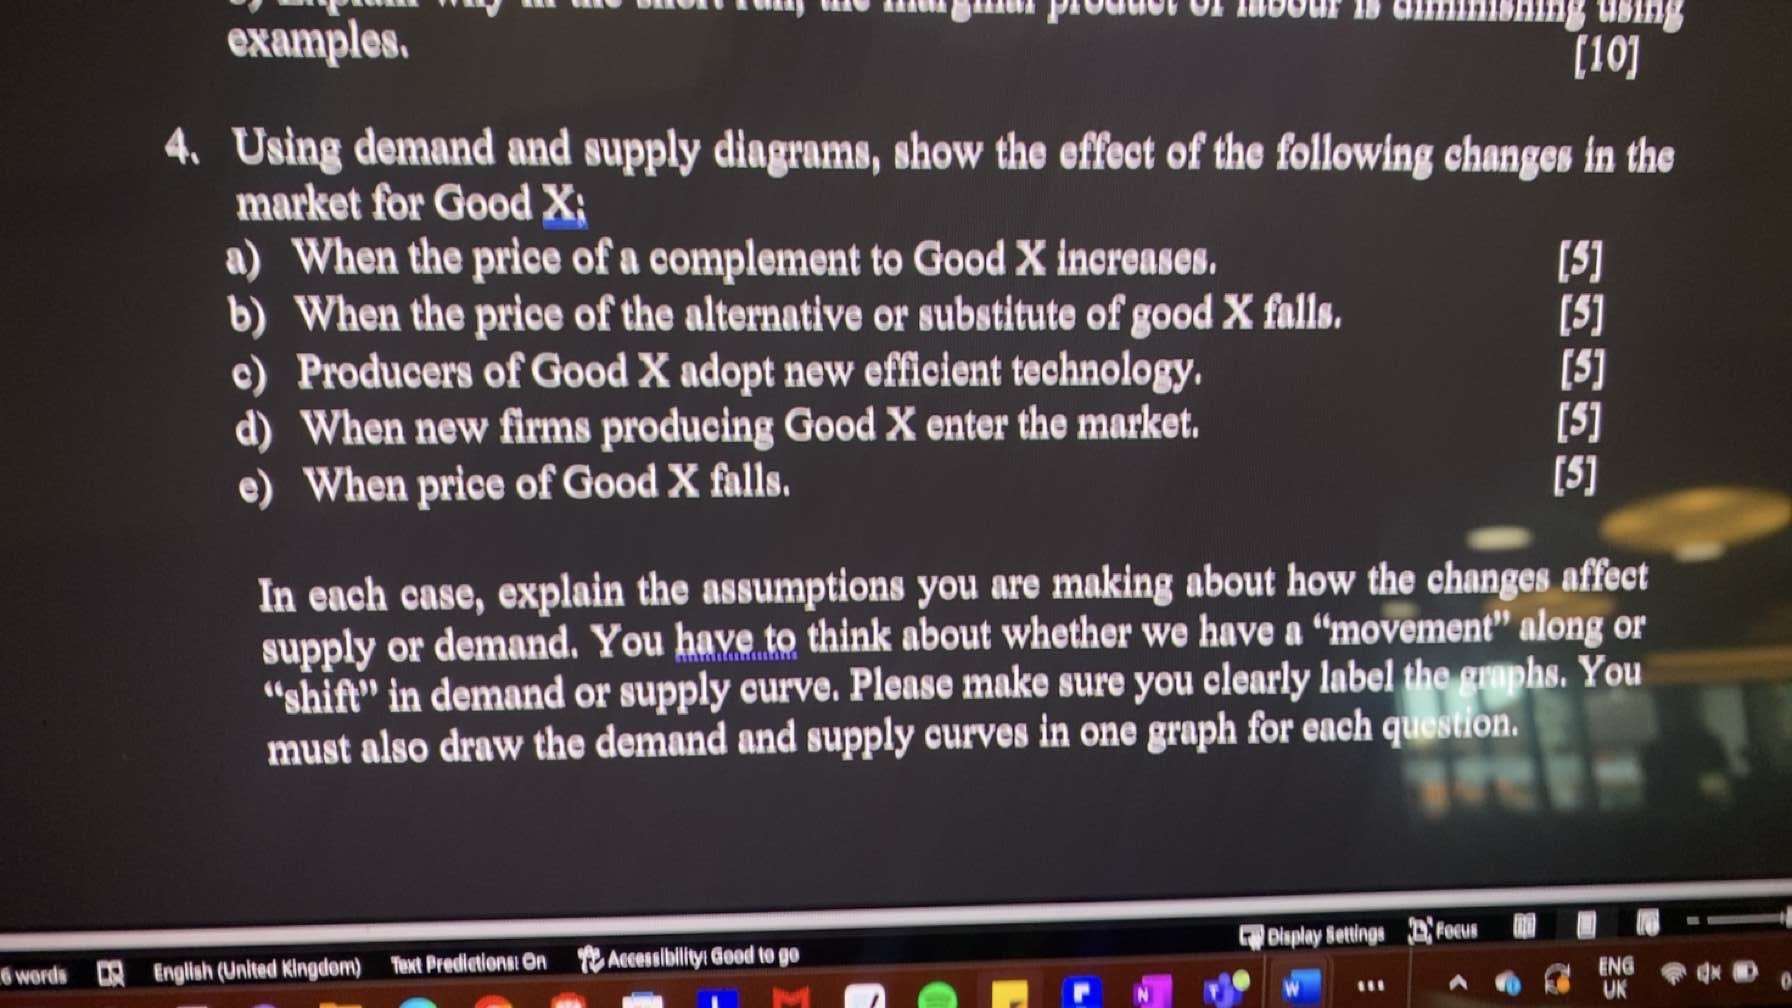
examples. Using demand and supply diagrams, show the effect of the following ehanges in the market for Good x i a ) When the price
examples.
Using demand and supply diagrams, show the effect of the following ehanges in the
market for Good
a When the price of a complement to Good inereases,
b When the price of the alternative or substitute of good falls.
c Producers of Good adopt new efficient technology.
d When new firms producing Good enter the market.
e When price of Good falls.
In each case, explain the assumptions you are making about how the changes affeet
supply or demand. You have to think about whether we have a "movement" along or
"shift" in demand or supply curve. Please make sure you clearly label the craphs. You
must also draw the demand and supply eurves in one graph for each question.

Step by Step Solution
There are 3 Steps involved in it
Step: 1

Get Instant Access to Expert-Tailored Solutions
See step-by-step solutions with expert insights and AI powered tools for academic success
Step: 2

Step: 3

Ace Your Homework with AI
Get the answers you need in no time with our AI-driven, step-by-step assistance
Get Started


